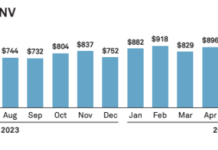
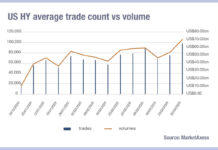
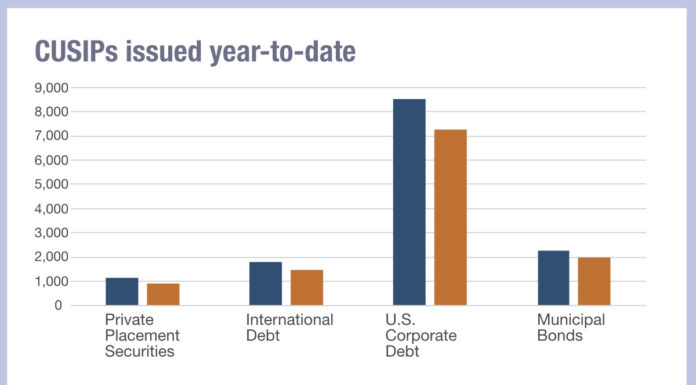
While issuance of emerging markets bonds beat the same period in 2023 by a third, secondary trading is far more choppy, with a stepped decline since the heights of February, and a gradual separation of trading volume and trade count, according to data from MarketAxess TraX, which follows activity across a range of markets.
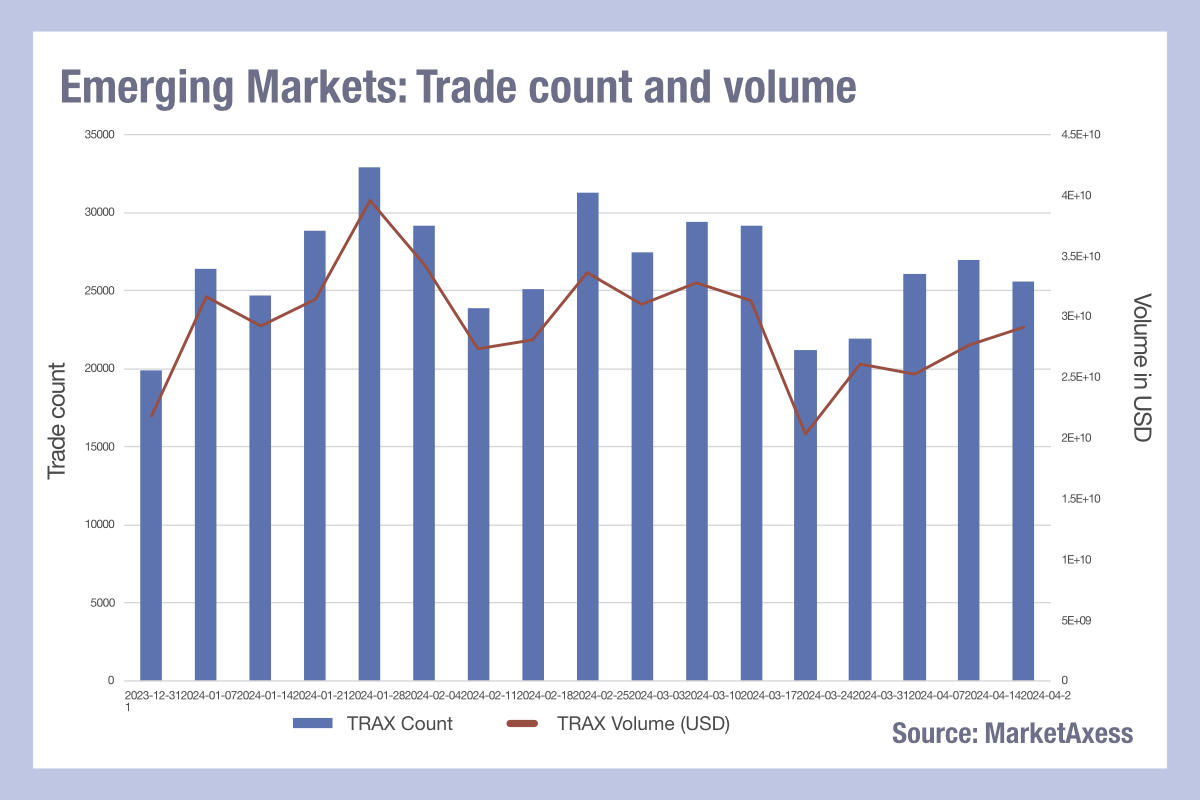
The trade count for EM bond market activity has declined less steeply than the trading volume over that period, indicating that EM bond trades are reducing in size. That reduction could be triggered by several factors, including dealers trading more odd lots to reduce inventory acquired from clients, increased use of electronic platforms to trade EM debt, greater participation by electronic market makers and potentially reduced reduction of risk trading by dealers, leading to a reduction in block trades.
Married to the lower trading volumes, and cognisant of the net outflows from EM funds recently, it seems likely that dealers are passing on positions acquired from clients’ selling activity inventory in EM and reducing inventory to support greater buying from clients.
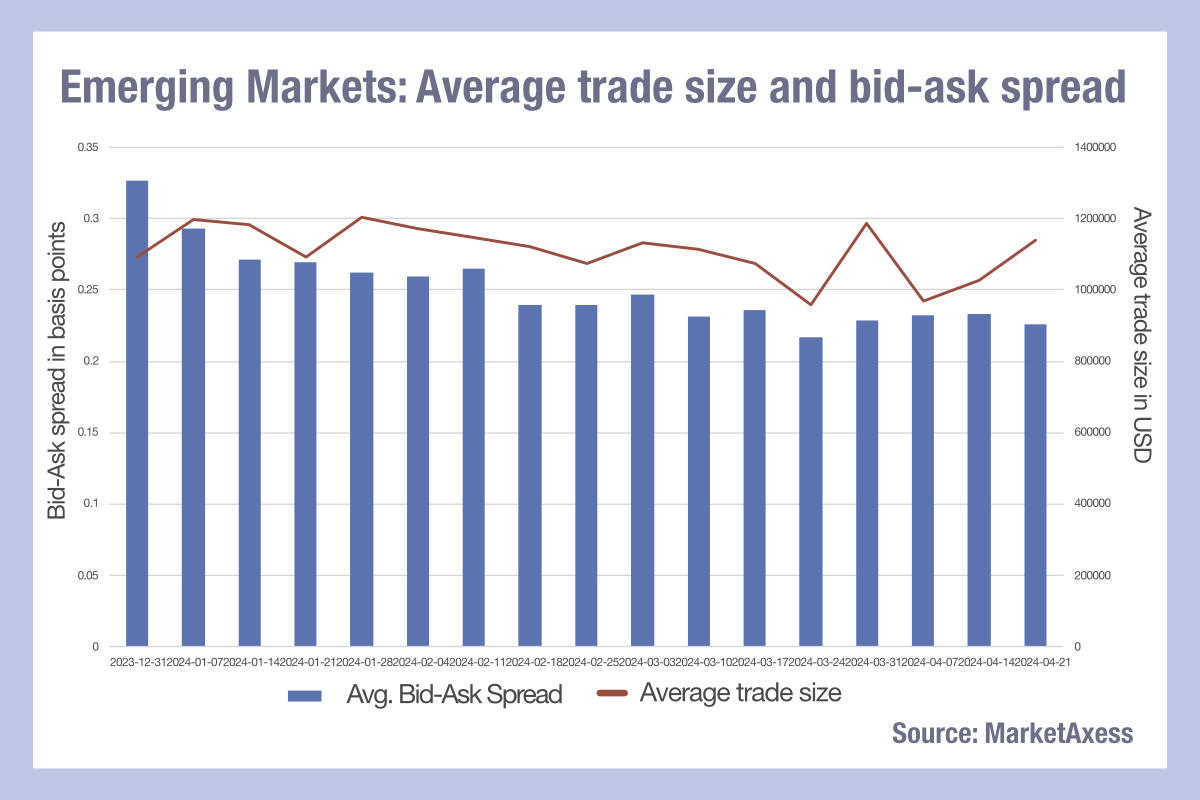
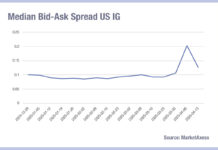
When we look at the average trade size, by cross referencing MarketAxess CP+ pricing composite with its TraX data, we can see that the bid-ask spread for EM debt has also been falling over the year, albeit not as consistently as trade size.
This also has implications. If the cost of liquidity is falling, while trades sizes are falling, trading in larger size may increase risk of information leakage without reducing the cost of execution.
It may be increasingly effective to trade in smaller size to reduce trading costs, and simultaneously to mask the size of a position or order. For EM traders, getting a deeper insight into this phenomenon for better execution.
©Markets Media Europe 2024
©Markets Media Europe 2025

