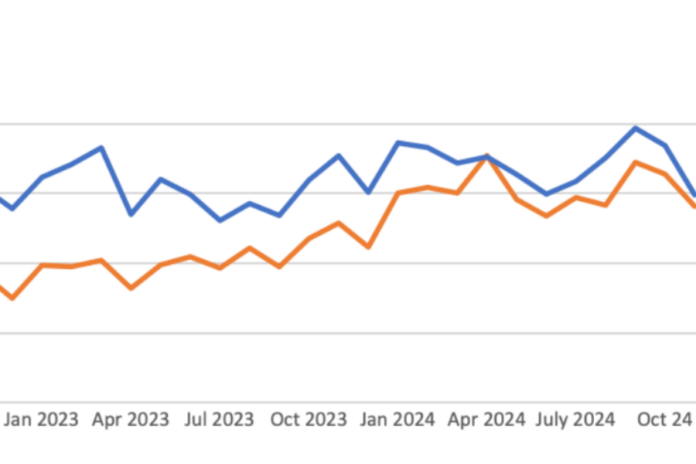
US credit e-trading volumes dipped for both MarketAxess and Tradeweb in November, the gap between the two platforms narrowing towards the end of the year.
Volumes of US$149 billion in US credit at MarketAxess were down 20% from October and 18% year-on-year (YoY). Chris Concannon, CEO of MarketAxess, acknowledged the decrease and stated that it was the result of lower credit spread volatility. Increased municipal bond activity and record volumes in emerging markets – US$3 billion ADV and US$799 billion overall – offset the decline.
E-traded US credit volumes fell slightly less at Tradeweb, down 15% from October to US$140.8 billion – but up 9% YoY.

Volumes for MarketAxess peaked in September, hitting year highs of US$196,949 million, while Tradeweb’s best performance was recorded in April – where it surpassed MarketAxess with US$176,367 million.
Although Tradeweb has not managed to trump MarketAxess before or since, the performance gap between the firms is the tightest it has been this November. Just US$8 billion of e-traded US credit volume sat between the two last month, compared to November 2023’s US$48,333 division.
Considering average daily volumes (ADV) for US credit, MarketAxess retained the lead with US$7.8 billion, down 7% YoY. Tradeweb was slightly behind with US$7.4 billion, up 18% YoY. Despite reporting the lowest ADV of the group, Trumid’s results rose 33% YoY from US$4.6 billion to US$6.1 billion.
MarketAxess
Total trading volume across all asset classes was up 47% at MarketAxess in November, reaching US$860 billion. Average daily volume was US$44.9 billion, up 56% year-on-year (YoY) – although dropping 5% from October’s record result of US$46.2 billion.
Eurobonds contributed US$42 billion in overall volume, falling 27% from October’s US$53.6 billion. YoY, volumes declined by a less drastic 4%.
By contrast, rates volumes were up 92% YoY, reaching US$584.9 billion. Overall growth was driven by increased agency and non-US government bond trading, up 157% YoY to US$27.7 billion. US government bonds were also up by 90% over the year.
However, these figures also represent a decline from October volumes. Overall, rates volumes were down 17% from October, with US government bonds falling 26%. Agency and non-US government bonds dropped just 1%.
Looking forward, Concannon said: “We recently launched our block trading solution, and we are experiencing positive client engagement in the emerging markets hard currency market. We have also enhanced our portfolio trading functionality to include benchmark trading. We believe both of these initiatives are critical to growing our market share in US credit in the coming quarters.”
Tradeweb
At Tradeweb, total trading volume across all asset classes was up 11% from October and up 22% YoY to US$48.8 trillion. Average daily volume was US$2.3 trillion, remaining static from October’s volumes and up 30% YoY.
European credit volumes of US$52.5 billion were up 9% from October, and up 3% YoY. Municipal bond volumes of US$7.7 trillion were down 11% from October, and down 28% YoY.
Rates volumes were US$25 trillion, rising 15% over the month and 2% over the year. US government bonds volumes of US$4.6 trillion were down slightly (4%) from October, but up 35% over the year. Mortgages and non-US government bonds contributed US$5.6 trillion, down 18% from October but up 10% YoY.
Trumid
Trumid reported 23% YoY market share growth in November across US investment grade (IG) and high yield (HY) corporate bonds, with platform participation increasing across all trading protocols and 910 buy- and sell-side institutions now active in the client network.
More than 1,000 individual traders have initiated a request-for-quote (RFQ) on the platform over the year, with November seeing a record number of daily RFQ trades being executed. In addition, more than 1,500 HY, IG and emerging markets portfolio trading lists have been traded on the platform year-to-date.
©Markets Media Europe 2024
©Markets Media Europe 2025

