Effectiveness for reporting and desk performance assessment improves year-on-year.
The DESK’s latest research into trading analytics has found its use growing within the trading workflow, and falling use for trader performance analysis.
The survey identifies differences between the effectiveness and the applied use of transaction cost / trade execution analytics (TCA/TEA).
Best application of analytics on buy-side desks
In 2021, it was clear that analytics were proving useful for traders who used them as part of the execution process, but they were frequently not used for that purpose.
Since then, their application in this task has increased – with effectiveness remaining at the same level – rising to 64% of respondents from 37%, a rise of 72% in use. This makes their use in the trading workflow the second most common application. Over the same period, the proportion using analytics to assess individual trader performance – a task for which trading analytics has consistently been seen as ineffective – fell from 37% to 28% (see Figs 1 & 2).
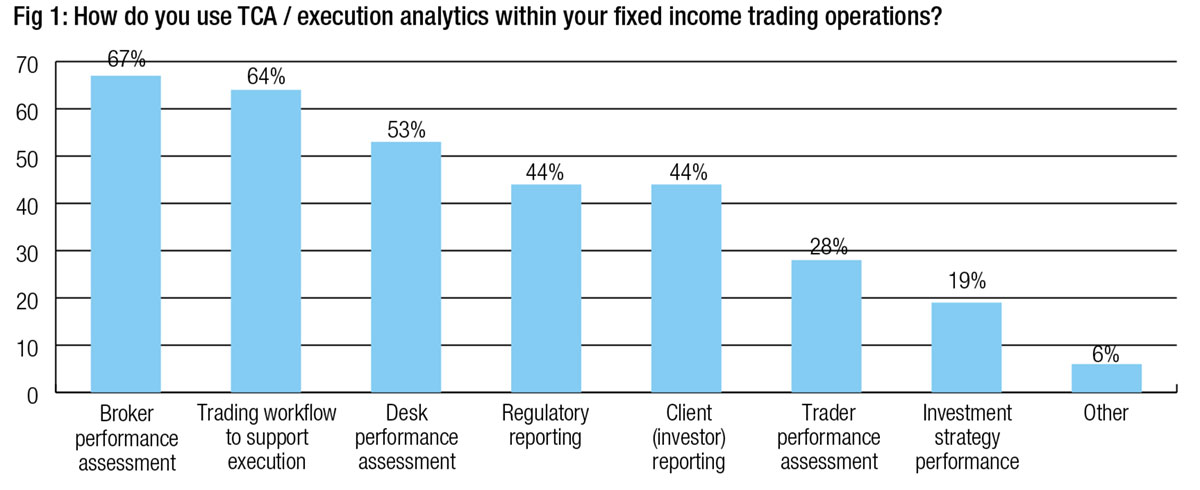
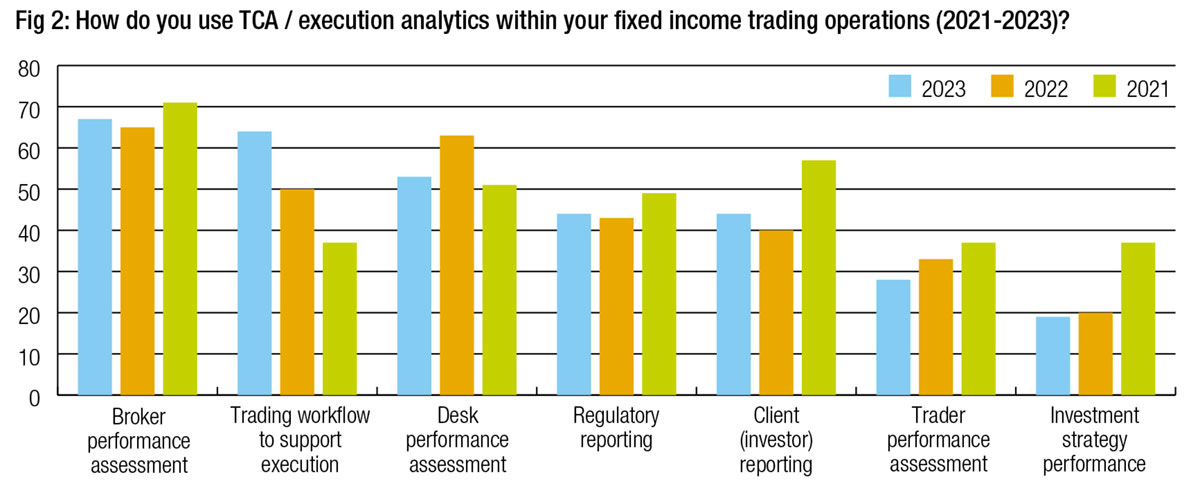
This suggests that trading desks are applying evolutionary pressure to analytics capabilities and adapting them to their best use cases.
Applying quantitative analysis to broker performance has consistently been the most popular use case and that sits well with the use case for TCA in the equity space where execution quality is assessed according to given metrics.
Although its use for desk assessment has declined relative to last year, that is still the third largest use case for analytics in 2023, followed by its application in reporting both at a regulatory level and for clients.
Main analytics providers
The use of third party analytics is still predominant on buy-side desks. While in-house analytics are a major source of insight, used by 58% of respondents, that has fallen from 74% in 2021. Ove that time period, the growth of third party analytics has increased from 60% to 64%. Broker analytics have had ups and downs, and remain in low single figures for our respondents (see Figs 3 & 4).
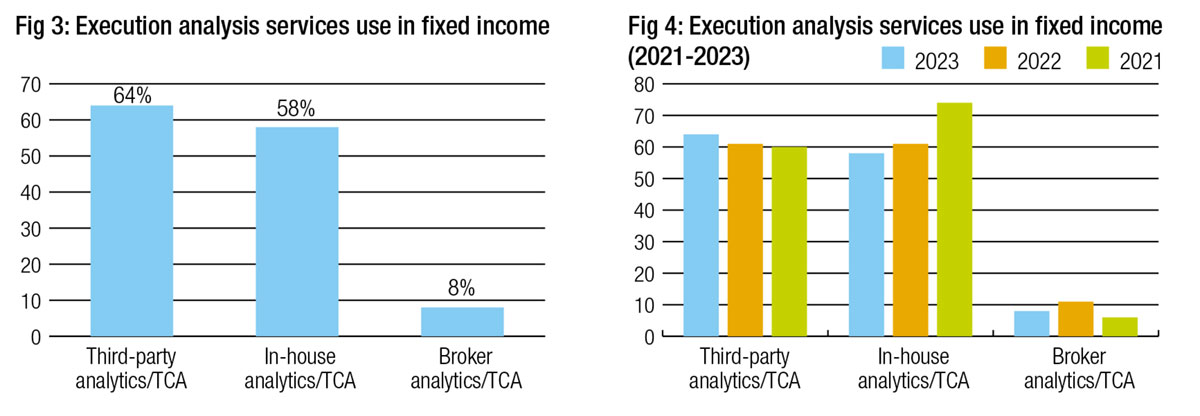
No standalone third party service has a majority of buy-side desks using its analytics, in contrast to the use of market data and trading platforms which we cover in the annual Q1 Trading Intentions Survey.
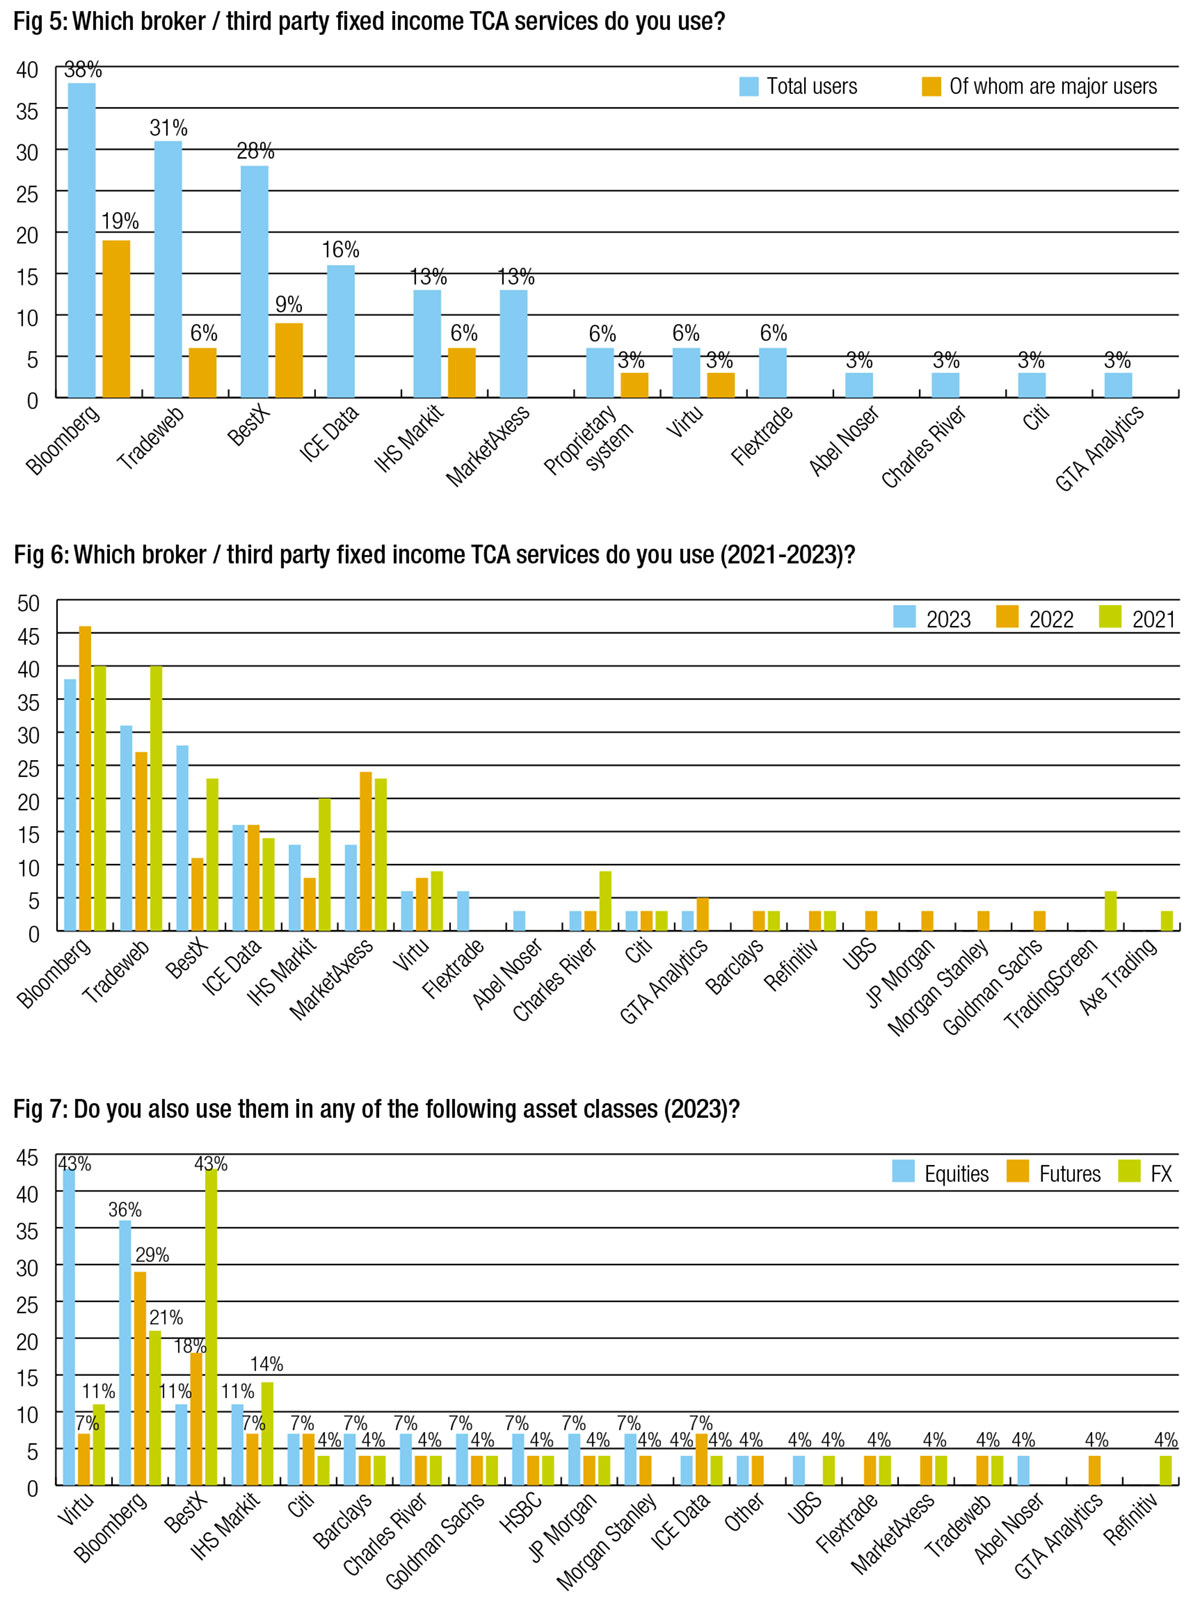
The most commonly-used third party provider is Bloomberg, a consistent leader since being a joint number one with Tradeweb in 2021 (see Figs 5 & 6). At 38% of respondents it has a solid user base. However, that does represent a fall in use from 46% last year.
Tradeweb recovered its strength this year with nearly a third of firms (31%) using its trade analytics tools.
The leaders are hotly pursued by BestX which has 28% of firms using it, more than doubling its user base from last year, and recovering to surpass its 2021 levels now making it a firm favourite.
MarketAxess has seen a drop off this year with 13% of respondents using its tools, down from 24% last year.
IHS Markit was on a par with this, also being used by 13% of respondents, up from 8% in 2022 when it had seen a big drop off.
Consistent performance from ICE Data Services puts it in fourth place this year, used by 16% of respondents, equal to last year and two percentage points up from 2021.
Exactly half of Bloomberg’s TCA respondents are classifying themselves as ‘major users’ based upon the amount they engage with the service, and the firm has seen this proportion grow every year. Tradeweb’s proportion of major users has remained steady at 5-6%. BestX has again see this jump, so that nearly a third of its users are consider themselves ‘major users’ in 2023.
Within other assets classes, Virtu leads in the equity space with 43% of respondent using it (see Fig 7). BestX has 43% of respondents applying it to FX market analytics. Bloomberg is the most used multi-asset trading analytics providers, leading in the futures market with 29% of users, and running in second place with equities and FX trading.
Nine percent of respondents are planning to use BestX in fixed income, and 6% plan to use MarketAxess.
How effective is TCA?
The effective application of TCA/analytics can very be broad. It includes the assessment of sell-side counterparties, for which 81% of respondents find it effective, regulatory and client reporting (77% and 70% finding it effective), followed by internal assessment measures (see Fig 8). At the top of these is trading desk performance measurement (68% find it effective) then use in the trading workflow, for which 59% find it effective. Less than half (46%) find it effective at measuring trader performance and investment strategy performance, but that is still a significant minority.
Over time that reflects improving effectiveness for analytics within fixed income markets, certainly since 2021, and in some use cases consistently over the last three years (see Fig 9).
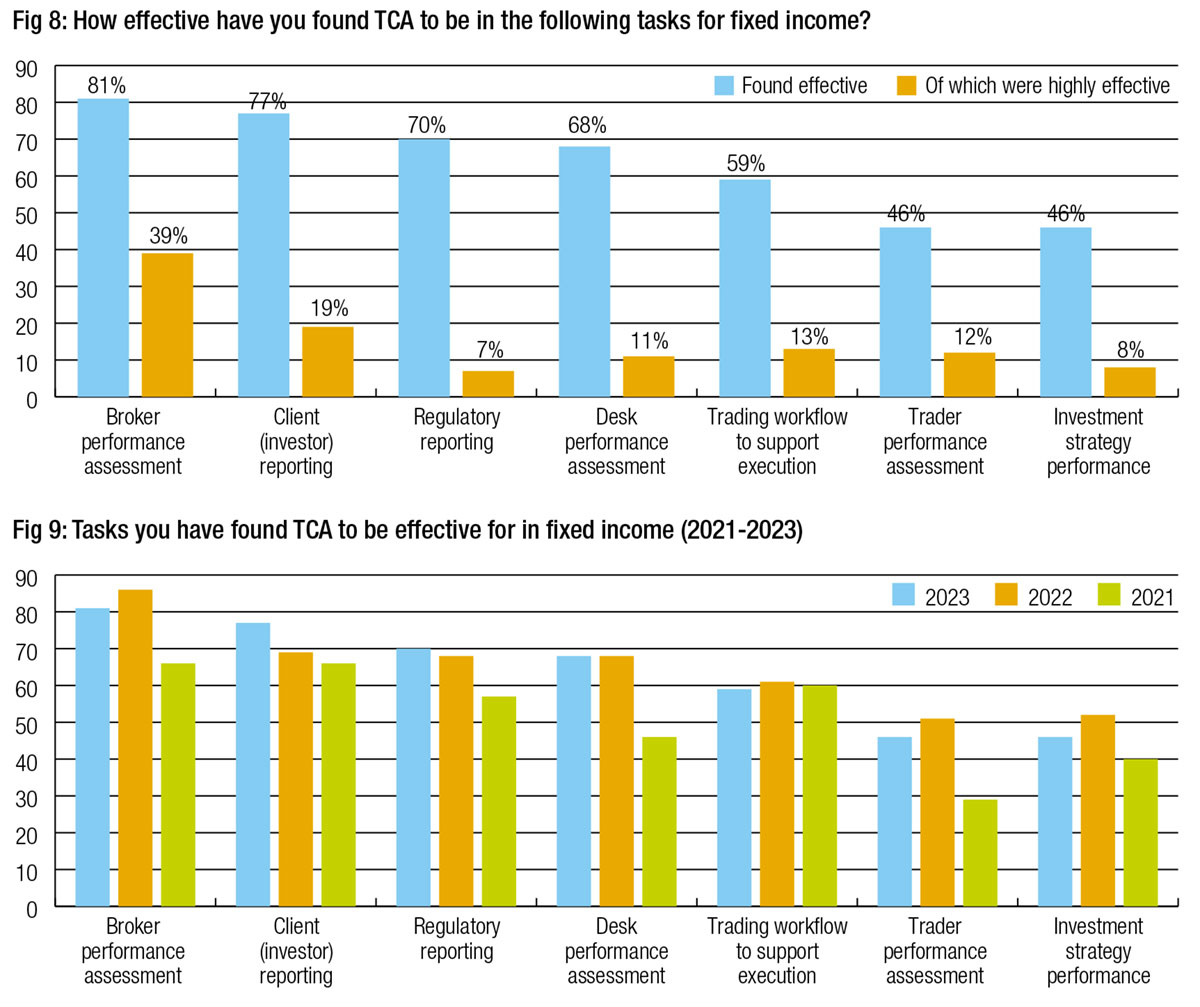
Another metric that has significantly increased for several use cases is the ‘highly effective’ category. In 2021, TCA was seen as highly effective by 11% of respondents in three categories; broker performance, regulatory reporting and client reporting (see Fig 10). Nothing else broke into double figures.
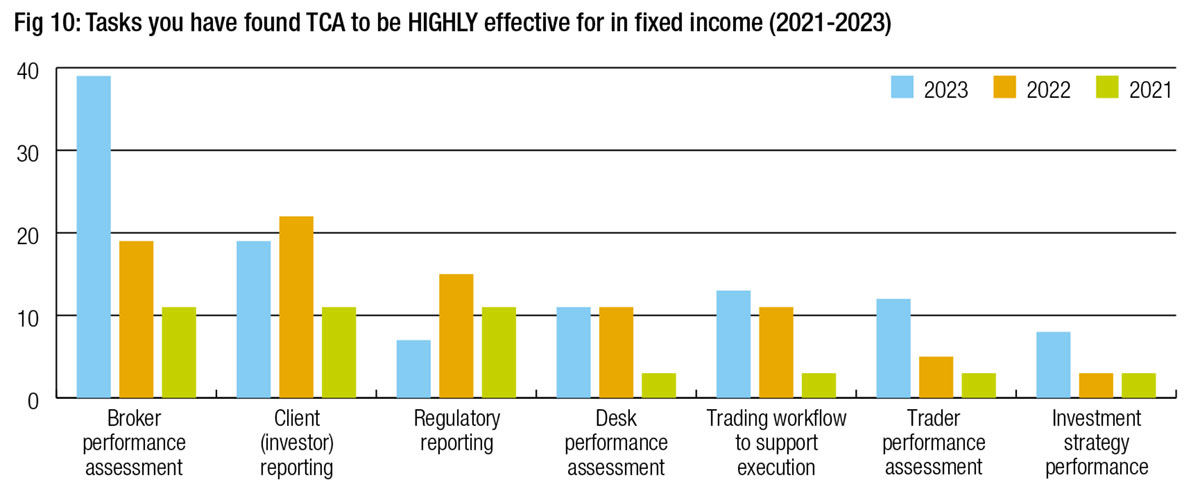
In 2023, 39% of respondents see TCA as ‘highly effective’ at assessing sell-side performance, more than triple the number two years ago.
Also seeing greater support as ‘highly effective’ functions are use in get trading workflow, trader assessment and investment strategy performance. While the first of these sees that effectiveness reflected in the growing application of TCA in the space, the latter two are falling in their use although both are slightly more effective than they were in 2021.
Getting better analytics
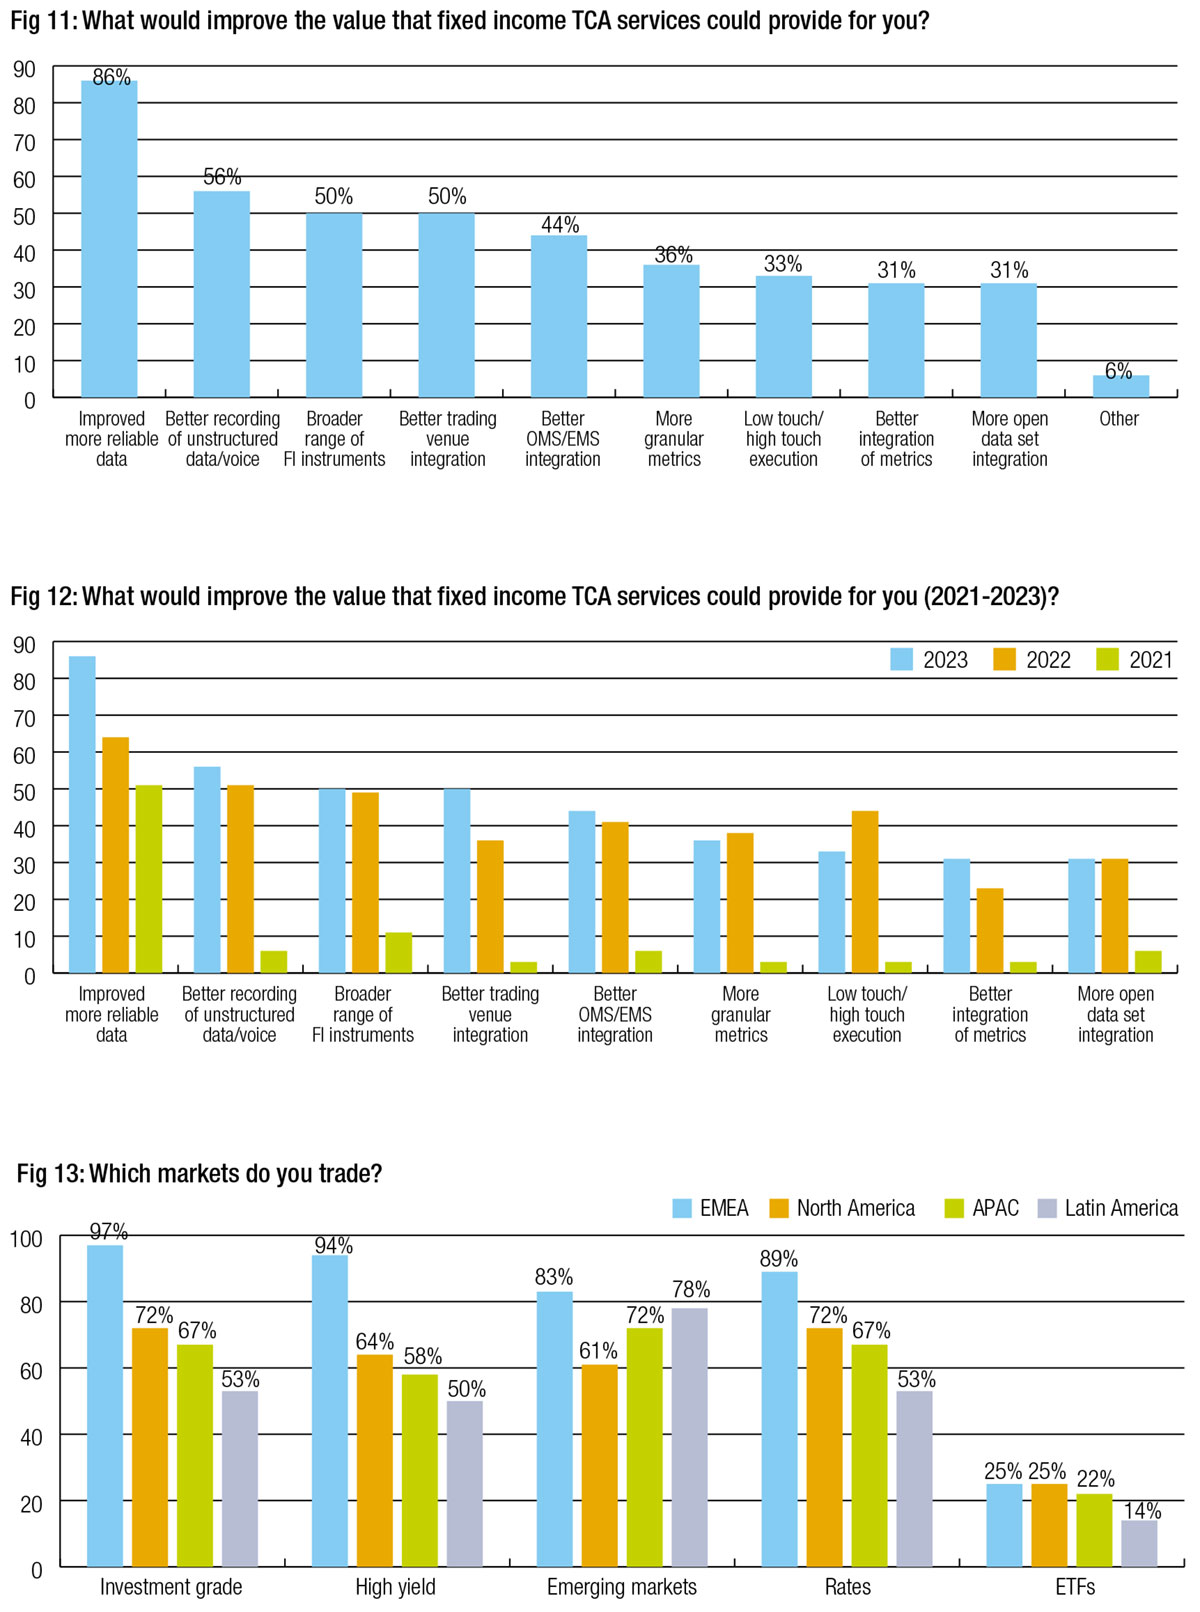
For better analytics, traders always want better data, and that has been the leading factor perceived to improve TCA each year (see Fig 11). For a market that is anywhere between 20-80% voice traded depending on the fixed income instrument in question and market activity, it is no surprise that better capturing of unstructured data would make a major improvement to trading analytics tools, the second highest factor noted by respondents.
Integration is a major factor with better connectivity with both venues (50% of respondents) and OMS/EMSs (44% of respondents) notable as improvements to analytics today. Those have both risen as concerns year-on-year since 2021 (see Fig 12).
Nevertheless, better data has grown in importance far outstripping the rest, representing the ongoing struggle in bond market transparency.
Demographics
Of the 36 buy-side firms who took part this year, nearly all traded European credit with three quarters to two thirds trading US credit, with a similar breakdown trading rates. Three quarters trading emerging market bonds in Europe, Latin America and Asia Pacific (see Fig 13).
Most respondents traded for traditional long-only strategies including pension, mutual (both at a major level), plus insurance funds, while the majority also traded for passive funds.
A quarter traded for hedge fund strategies, all at a major level.
©Markets Media Europe 2023
©Markets Media Europe 2025

