Leveraging Trax’s vast market data set, the Trax Facts quarterly review provides a detailed analysis of activity across fixed income markets, including: Corporates, Agencies, Governments, Asset Backed Securities and Emerging Markets. Here we publish a summary of the Q3, 2017 review.
European FI market by total traded volume
The third quarter of 2017 saw the characteristic drop off in trading volumes for this period, however to a greater extent in 2017 than in previous years. While volume is not a proxy for liquidity, falling volumes indicate turnover of securities is typically lower in the third quarter of a year relative to the first half of the year (see Fig 1).
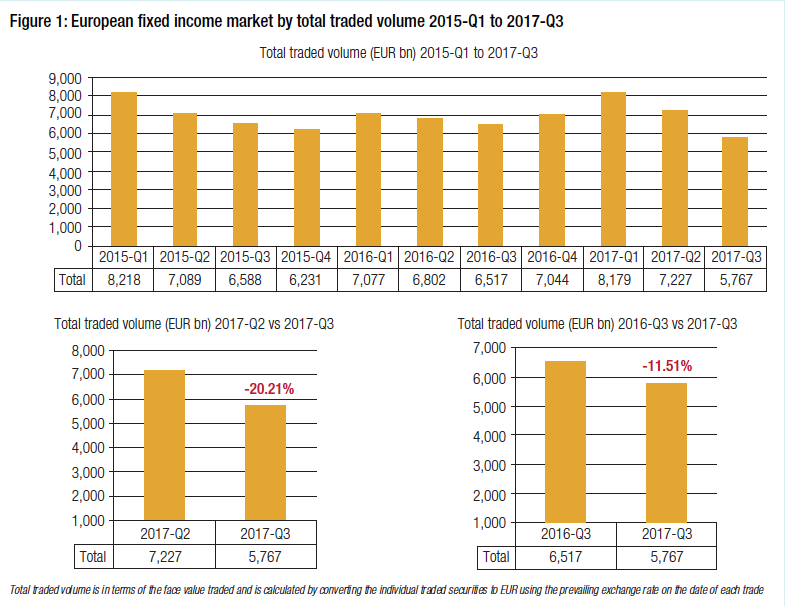
The average daily traded volume for fixed income instruments in Europe for the third quarter of 2017 fell to E90 billion, from E118 billion in Q2 and E128 billion in Q1, according to Trax data. That means Q3 volume fell 10% on a year ago, when trading volume for Q3 2016 hit E100 billion. The same pattern of decline can be found in trade count annually.
European FI market by trade count (Fig 2)
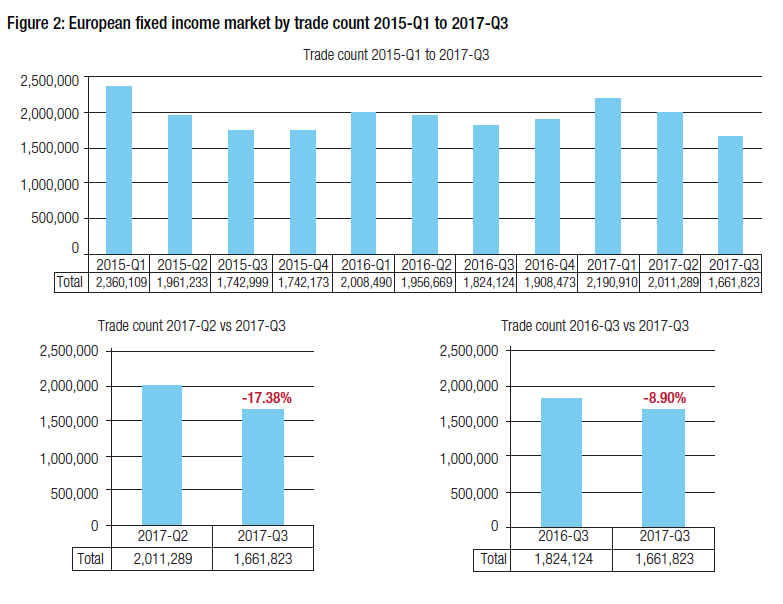
The 29% drop in average daily volume from Q1 in 2017 is proportionally greater than the fall in 2016, which saw a 12% drop in volume from Q1 to Q3 2016 and the fall was a little greater than the 22% decline experienced in 2015 over that period.
European FI market corporate activity
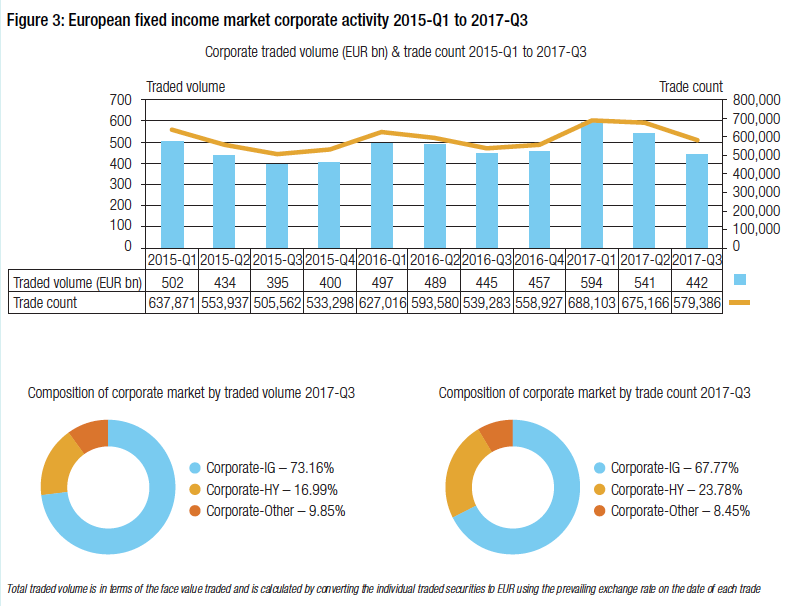
Corporate Investment Grade in Europe saw average daily volume fall by nearly 24% quarter-on-quarter. That was on a par with volume for Q3 2016 at just over E5 billion ADV. High yield credit saw ADV in Q3 fall 16.5% against Q2 but only saw a 3% drop on last year’s Q3 ADV (see Fig 3).
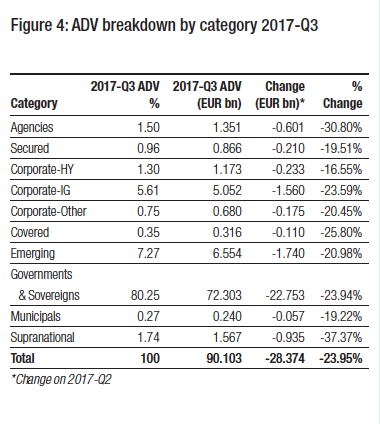
Average Daily Volume (ADV) breakdown by category
Meanwhile European government and sovereign bond ADV declined by nearly 24% in Q3 against the previous quarter and were down 10% against Q3 last year (see Fig 4).

©Markets Media Europe 2025


