Current US Treasury market liquidity is comparable with the 2007-09 global financial crisis and the March 2020 crisis, particularly for the two-year note, according to a quantitative assessment of interdealer trading by New York Federal Reserve economists.
The study, published by the Fed’s ‘Liberty Street Economics’ team, looked at data from Brokertec the electronic platform for dealer-to-dealer (D2D) trading in the US treasuries space, between 2019 and October 2022. Brokertec is estimated by the Fed to account for 80% of (D2D) volume. The economists assessed liquidity across several measures including bid-ask spread, order book depth and price impact, as well as an assessment of these metrics set against price volatility to track relative levels.
It found that the bid-ask spreads are wider than the norm since 2019 although they are far from the levels seen in March 2020. As bid-ask spreads only reflect active dealer pricing and not any withdrawal of volume, they can only represent one aspect of liquidity.

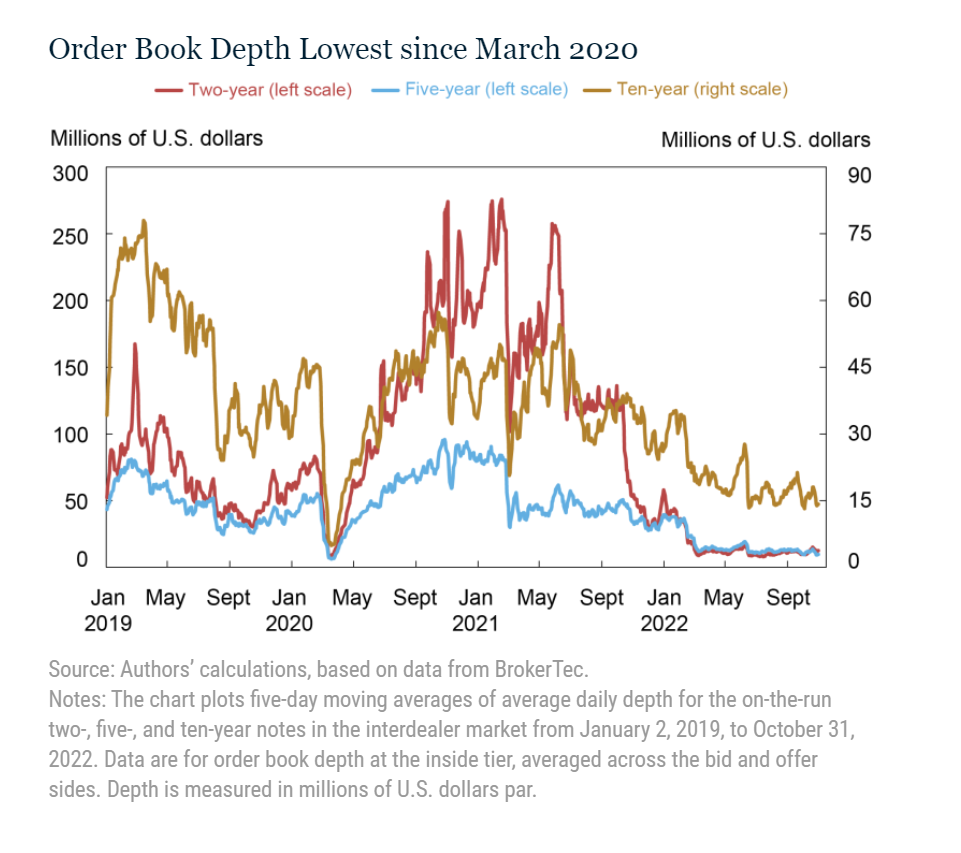
The order book – which does reflect the engagement of dealers – has been at levels which point to poor liquidity in 2022 relative to other periods. Order book depth for the two-year note has been at March 2020 levels, while the five-year note has remained somewhat deeper and the ten-year note appreciably deeper than for that period.

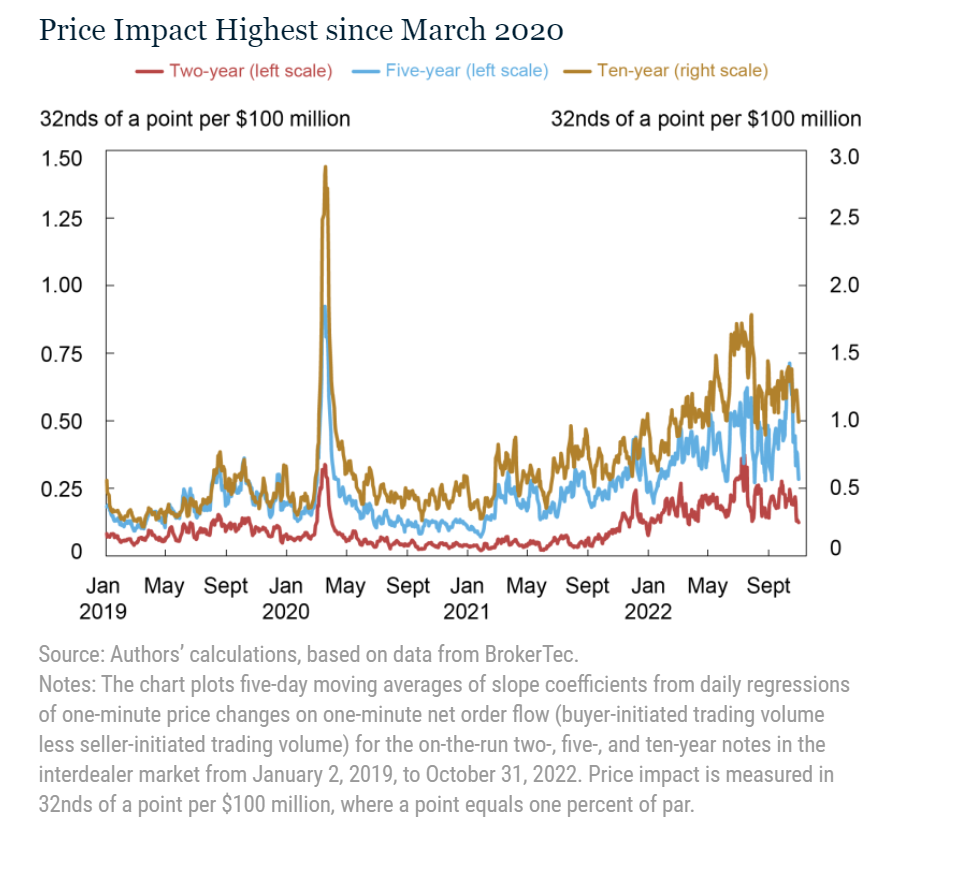
A third measure of liquidity – that of price impact – reflects the depth of the market to absorb a trade. This has also been worse in 2022 than in previous periods. Although the study only captured data to 2019, the economist team, led by Michael Fleming, head of Capital Markets Studies in the Federal Reserve Bank of New York’s Research and Statistics Group, looked further back for this metric and found that price impact was comparable to levels seen in the 2007-09 financial crisis.
“Volatility has caused market makers to widen their bid-ask spreads and post less depth at any given price, to manage the increased risk of taking on positions, and for the price impact of trades to increase, illustrating the well-known negative relationship between volatility and liquidity,” they wrote.
By comparing historical volatility with these measure of liquidity, the team found that the five-year and ten-year notes were within the expected ranges relative to vol in normal periods, however the the two-year note had a higher-than-expected price impact, an aspect which was also seen in the autumn of 2008 and in March 2020.
“The market’s capacity to smoothly handle large flows has been of ongoing concern since March 2020 … as Treasury debt outstanding continues to grow,” the team wrote. “Moreover, lower-than-usual liquidity implies that a liquidity shock will have larger-than-usual effects on prices and perhaps be more likely to precipitate a negative feedback loop between security sales, volatility, and illiquidity. Close monitoring of Treasury market liquidity – and continued efforts to improve the market’s resilience – remain important.”
©Markets Media Europe 2022
©Markets Media Europe 2025


