Concern about liquidity shortfalls at year end could be alleviated by electronic market makers say traders, and the data seems to back them up.
A seasonal shortage of liquidity at year end is often attributed to the withdrawal of dealer activity as they optimise their holdings of risk assets. The quarterly reporting of capital ratios to regulators creates a skewing of activity away from capital-intensive work at quarter end. This ‘window dressing’ is a longstanding issue, and can impact market liquidity.
James Athey, senior fund manager for UK fixed interest & global fixed interest asset manager at Marlborough, speaking with Markets Media’s Trader TV, said “Year end is known as a tricky period for liquidity. What happens, is that banking regulation really is only adhered to at period ends, where regulators take snapshots of bank balance sheets in order to judge various criteria relative to regulation, things like liquidity and leverage ratios. So banks behave exactly as they wish to between quarterly earnings, and then they tidy up or window dress their balance sheets at those period ends when these snapshots are taken. Year end is a particularly big one.”
Under the Basel III regime, banks’ leverage ratio is a 3% minimum level that a bank has to meet, typically reported at quarter end, calculated by dividing their Tier 1 capital by the sum of exposures across all assets and non-balance sheet items. In some cases they are also able to report an average of exposure daily or month-end exposure levels if the national regulator agrees. The ratio acts as a buffer against excessive leverage on the sell side, addressing systemic risks that were created through dealer exposure to leverage in the 2007 financial crisis.

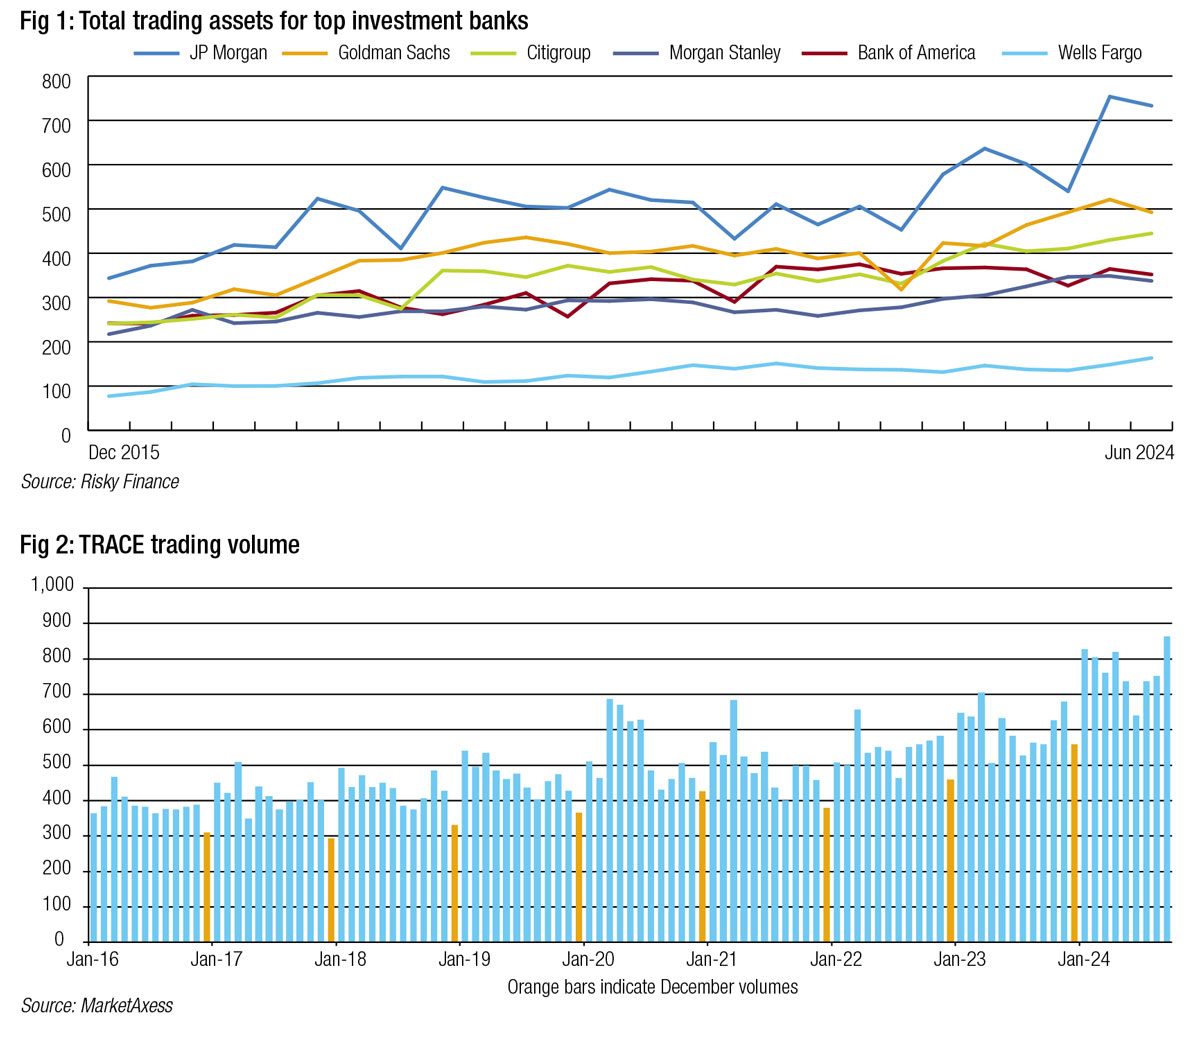
Overall levels of trading assets held by banks decline towards year end (Fig 1) for big investment banks, but the levels differ considerably dependent upon the businesses they operate in.
This phenomenon of window dressing is well known to authorities, with the Bank of International settlements writing in 2021, “We find that globally systemic important banks (G-SIBs) compress their balance sheet at year-end to an extent that they can reduce their surcharges or avoid G-SIB designation altogether. G-SIBs use several levers to adjust their balance sheets. Most notably, they compress intra-financial system assets and liabilities as well as their derivative books at year-end. Moreover, G-SIBs that are more tightly constrained by capital requirements window dress more than their peers. Our findings underscore the importance of supervisory judgement in the assessment of G-SIBs and call for greater use of average as opposed to point-in-time data to measure banks’ systemic importance.”
Looking at MarketAxess data since 2016 (Fig 2), December bond trading volumes average 20.2% below the year-to-date (YTD) average in TRACE.

However, changes to market liquidity provision, driven by participation from electronic liquidity providers and increased month-end activity through portfolio trading, appear to be mitigating the effects of this liquidity shortfall.
“In terms of trading liquidity within fixed income markets, liquidity conditions currently are still good,” said Athey. “Naturally, in general, liquidity conditions within credit markets have actually been particularly good for a long period of time. And this possibly relates to the entrance of some of these more modern, technologically-driven market makers, the likes of Jane Street, who potentially have improved liquidity conditions in credit markets during normal times.”
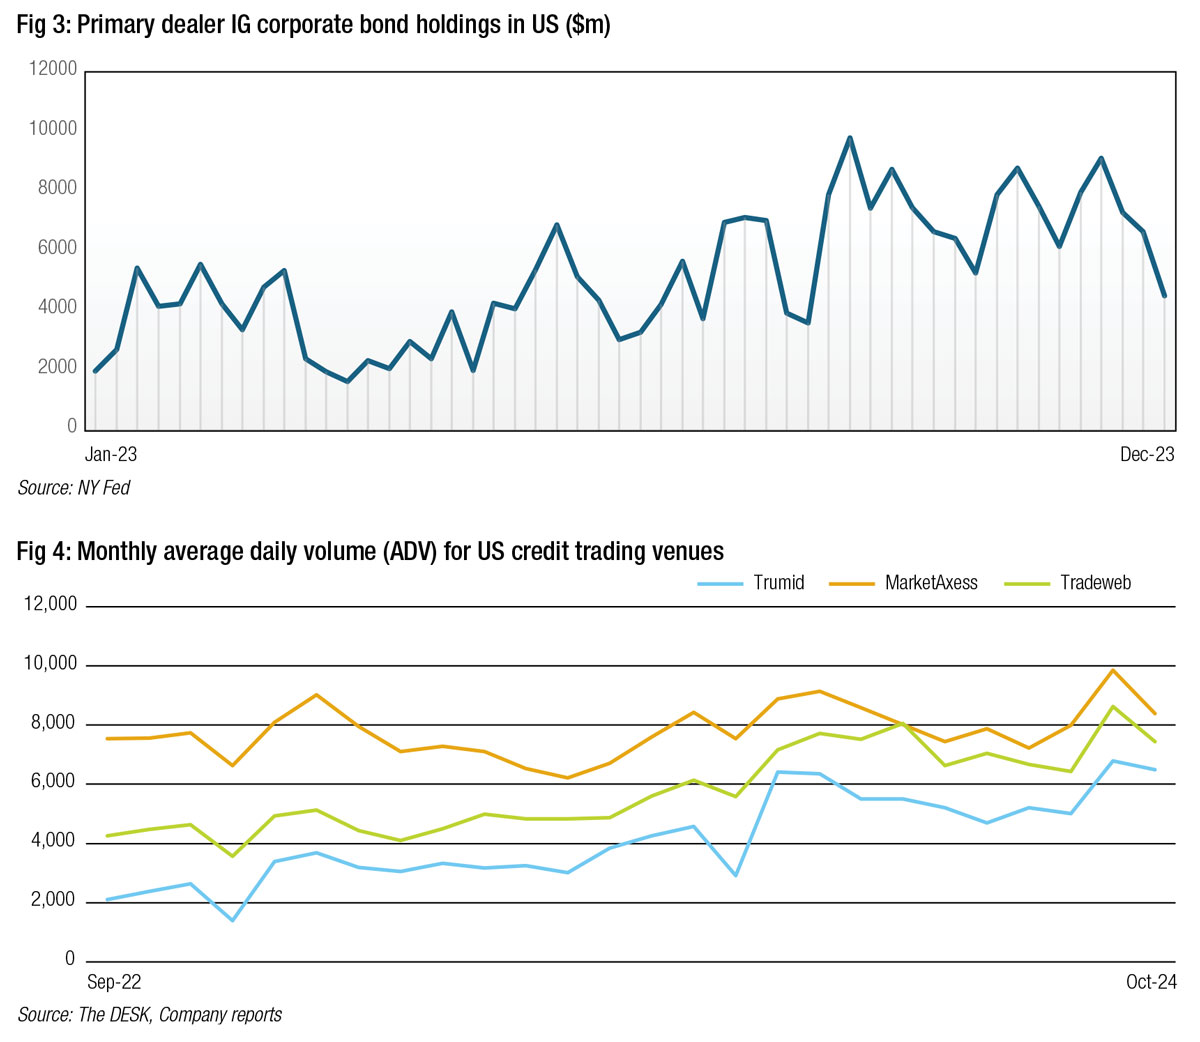
While dealer inventory typically reduces at quarter end in corporate bond markets (Fig 3), electronic trading volumes for corporate bond trading have continued to rise in 2024, with platforms including MarketAxess, Tradeweb and Trumid all growing market activity levels (Fig 4).

“Post-election market activity has been remarkable, with volumes surging and major indices reaching all-time highs,” says Jeff O’Connor, head of market structure at Liquidnet. “However, as we move closer to the year end, we expect this momentum to subside, with a focus shifting to upcoming macroeconomic data releases such as ISM, non-farm payrolls, CPI, and the FOMC meeting on 18 December.”
This activity has been facilitated not only by traditional dealers and investors but also by the growth of those electronic liquidity providers and new forms of trading protocols.

To assess the impact of capital adequacy ratios on trading, we need to look at more specific data than volumes. The trading activity that is most impacted by leverage and liquidity ratios is that which carries risk and requires banks to carry inventory on their books.
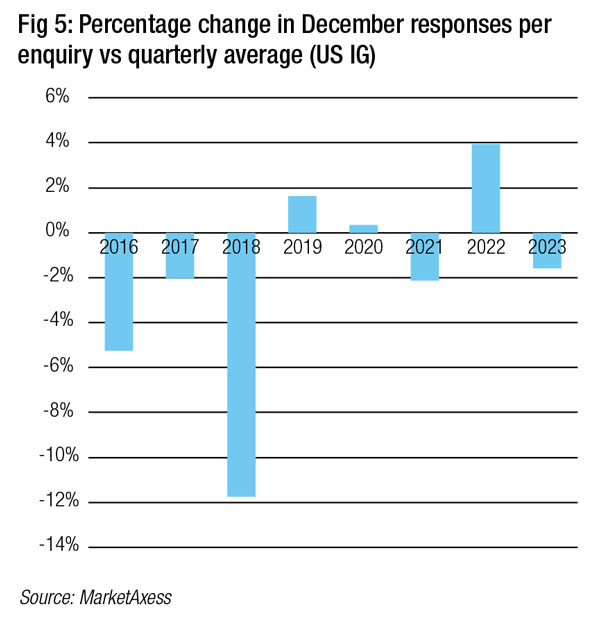
We looked at the number of responses to enquiries on MarketAxess for the final quarter of each year, and the number of responses to enquiries in December of each year, from 2016 to 2023. If the number of responses was proportionally lower in December than in the rest of the quarter, it would suggest that market makers reduced activity at year end.
 We found (Fig 5) that the percentage change in responses over that seven-year period had gradually reduced, with positive increased response levels in December 2019 and 2020, and 2022 seeing a 4% increase in response rate in December.
This suggests that although volumes and dealer inventory typically decline at year end, the level of responsiveness has increased.
The positive current environment should not be taken for granted, and there are clearly potential risks as liquidity models change.
Athey noted, “It’s likely that some of the algorithms, some of the machines which are used to make those markets, provide that liquidity and that price discovery, might be turned off during volatile conditions, and so we could find that liquidity conditions deteriorate much more dramatically than we might expect during periods of excess volatility. So, we do have concerns looking to year end. We do have some concerns in general about the modern structure of markets. But as we sit here today, really, we would observe that liquidity conditions look good.”
Liquidity shocks are possible, notes O’Connor, with a number of macro elements potentially having an effect as the year wraps up.
“Institutional volumes have been robust throughout 2024, but with cash levels at historic lows among asset managers and valuations appearing overstretched, a pullback seems inevitable,” he says. “The ‘sit on your hands’ mentality could take hold as we approach the presidential transition in January. Higher interest rates – evident in the 10-year note’s climb – may also start capping equity performance. From a liquidity standpoint, the heavy institutional flows we’ve seen are unlikely to persist indefinitely.”
©Markets Media Europe 2025


