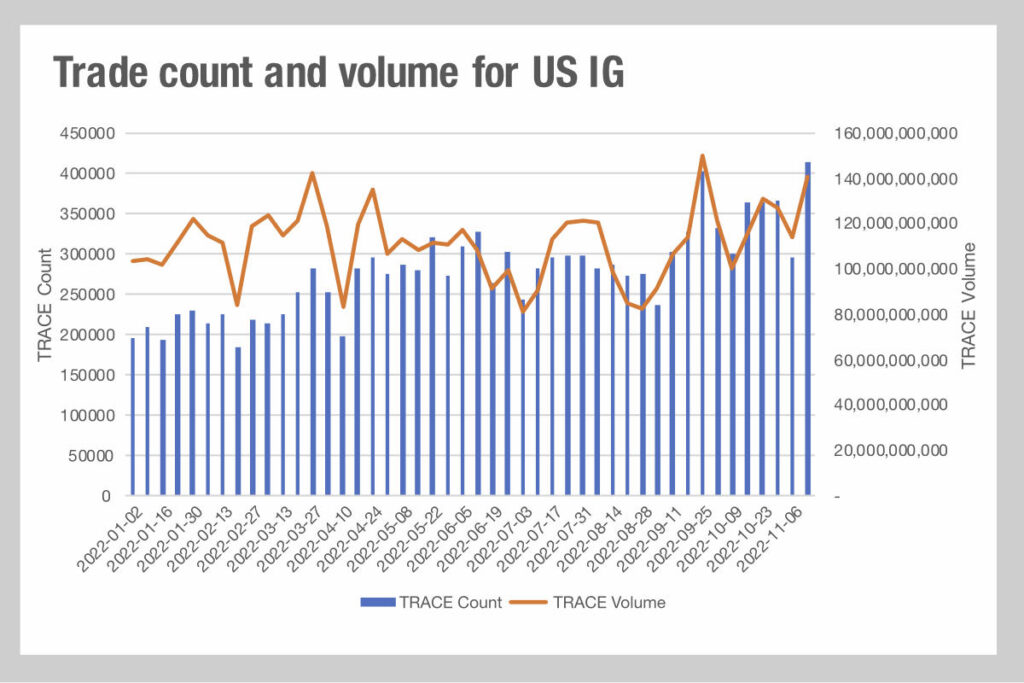
Looking at data on US credit markets, taken from MarketAxess Trax, which tracks trading across multiple markets and counterparties, investment grade trading volumes have been rising over 2022, as has the trade count.
While volume can give some indication of market liquidity, the faster rise of the number of trades suggests that order flow is fragmenting during the year, resulting in a greater number of trades per value traded.
That could present a more challenging market in which to trade. Firstly, more trades to manage potentially requires a larger amount of time to trade, if these are each handled individually. Secondly, they require more work for dealers, as they need to find the other side to more trades in order to get out of the positions.
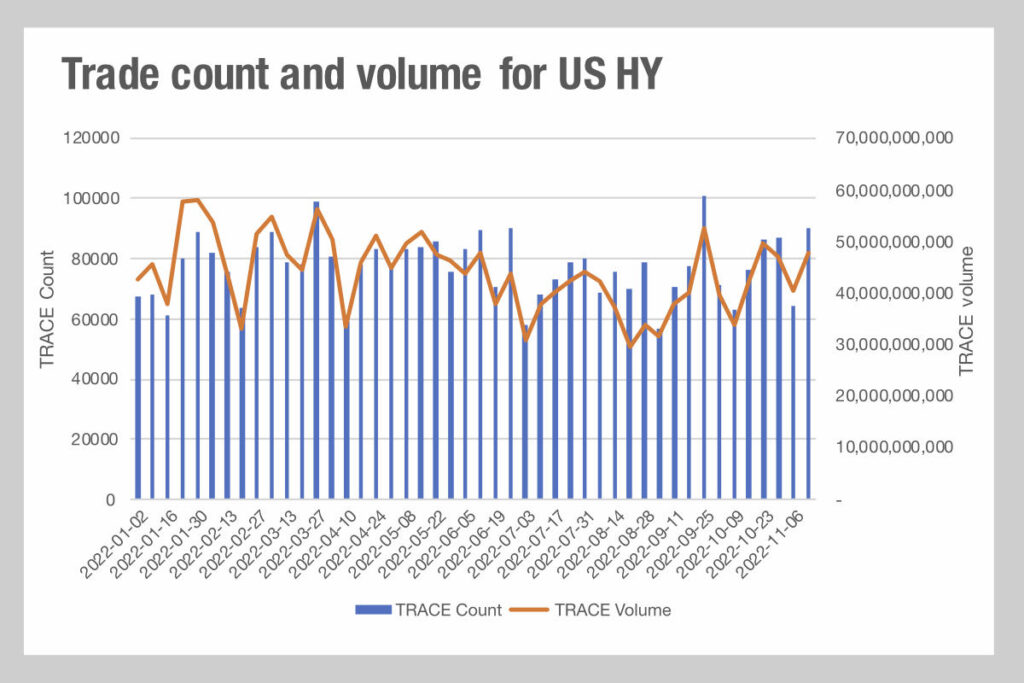
It’s worth noting that in high yield (HY), Trax data indicates that although a similar dynamic has played out, both volume and trade count has been more level this year, and the higher trade counts seen in HY for November are not the highest this year – unlike in IG.
At the same time, bid-ask spreads in the IG market have fallen a little in aggregate towards the end of the year, but with spikes in June and October, and an uptick in mid-November trading costs are still higher than at the start of the year.
Anecdotally traders have reported no problems in trading US IG year to date, suggesting that the impact of these indicators has not been significant yet, however 2023 may prove more challenging as reduced debt issuance and Fed support for markets focuses liquidity into secondary trading through natural market making and investment.
There may also be a positive outcome – electronic trading. This has been rising so that average daily volume (ADV) has hit US$36 billion year to date, and making up 40% of all trades in IG markets. That represents a 7% increase and given that the higher proportion of e-trading is for smaller trade sizes this may well represent a greater adoption in order to handle the higher trade count more efficiently.
©Markets Media Europe 2022
©Markets Media Europe 2025


