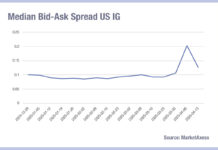
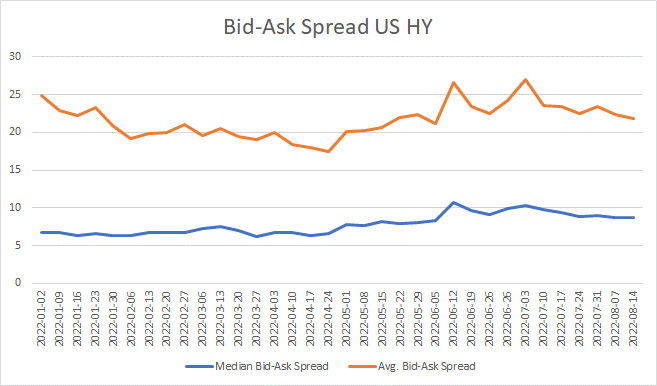
June looked decidedly challenging for US high yield (HY) trading, as mean bid-ask (BA) spreads dislocated from the median, indicating spikes in BA spreads across certain sectors or even big issuers, as they became more expensive to trade.

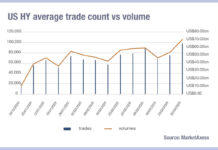
Over the same period trading volumes became more volatile and trade volumes became even more dislocated from trade count. Lower volumes and higher count equals a larger proportion of smaller tickets being traded, indicative of lower liquidity.
What characterises the following months is far more positive. In July and to a greater extent August, BA spreads have begun to tighten. Trade count has declined relative to volume, which has increased on a weekly basis over the short term, even if we see TRACE data indicating monthly ADV is falling.
These are some positive signs for HY trading, and even surprising, given the expectation of lower trading activity in the summer months, set against the reality of trading volumes that are at Q1 levels.
Such uncharacteristic activity speaks to the importance of good pre-trade data analysis, and market data more widely to identify when trades can be conducted most effectively without increasing costs for investors.
As observed in this fortnight’s primary markets BoB article, issuance has collapsed in US HY and there may be a cliff edge of available bonds. If that analysis is correct, getting portfolios as well-constructed as possible should take place during this liquid market period.
©Markets Media Europe 2022
©Markets Media Europe 2025

