Corporate bond traders has seen the average trade size reducing in Europe across both investment grade and high yield, suggesting that block trading is becoming harder, according to weekly volume data from MarketAxess Trax, which tracks trading across multiple markets and counterparties.
The rising number of trades, with a corresponding decline in the notional value being executed, indicates more trades are taking place of a smaller size. In investment grade overall activity has declined since the start of the year, but volume by notional began to fall in February, where the trade count continued to ride upwards until March before dropping off.
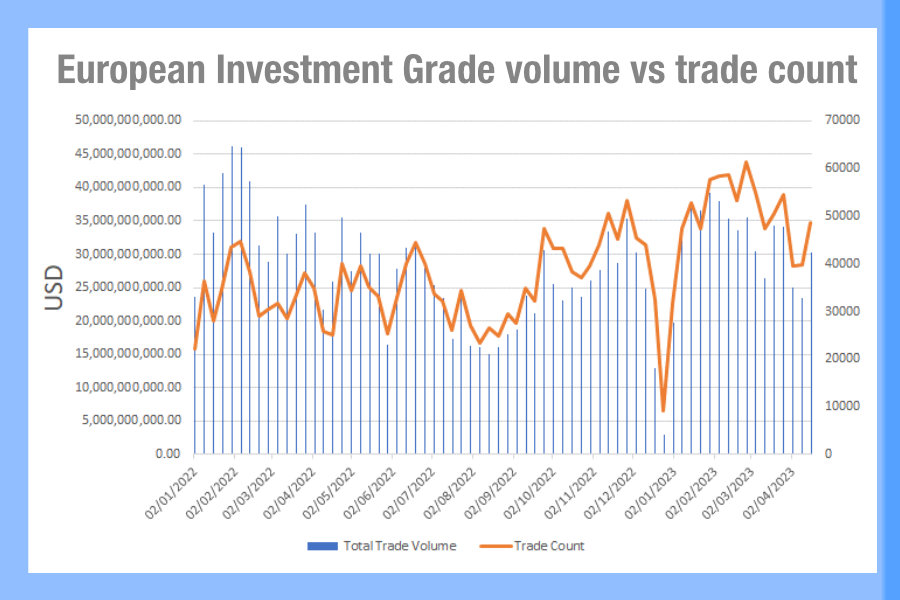
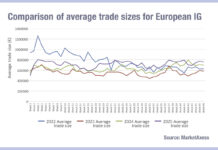
Looking at the average size traded per week, based on the trade volume being split across the trade count, we can see the average size collapsed over last year from US$1.1-1.2 million at the start of 2022, becoming range bound by August – and to date – around the US$600k size. While that does not reflect differences between tenors etc which impact available liquidity, it does suggest overall that trading may be executed more effectively via electronic channels in order to minimise information leakage. High yield saw volumes and trade count correlate more closely in Europe this year, having seen a more substantial dislocation than IG bonds in 2022. This is still somewhat in evidence today, however not to the same level.
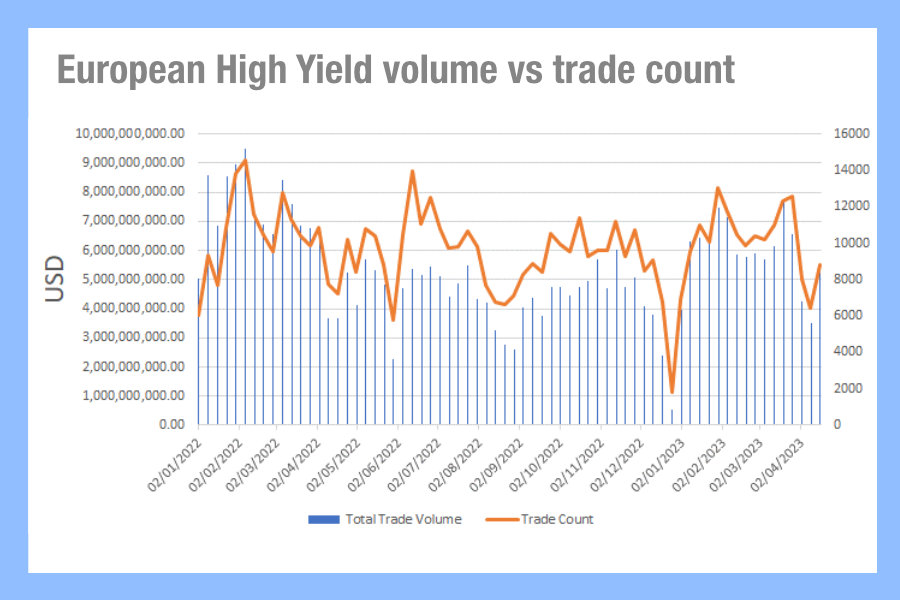
The average size traded, based on weekly averages, has been lower in HY than in IG during 2022, dropping faster a the start of that year with more pronounced steps, and bounced back this year to match the range that IG is tracking.
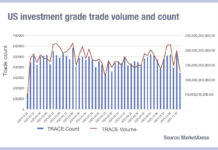
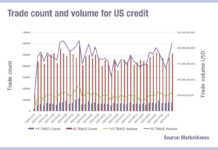
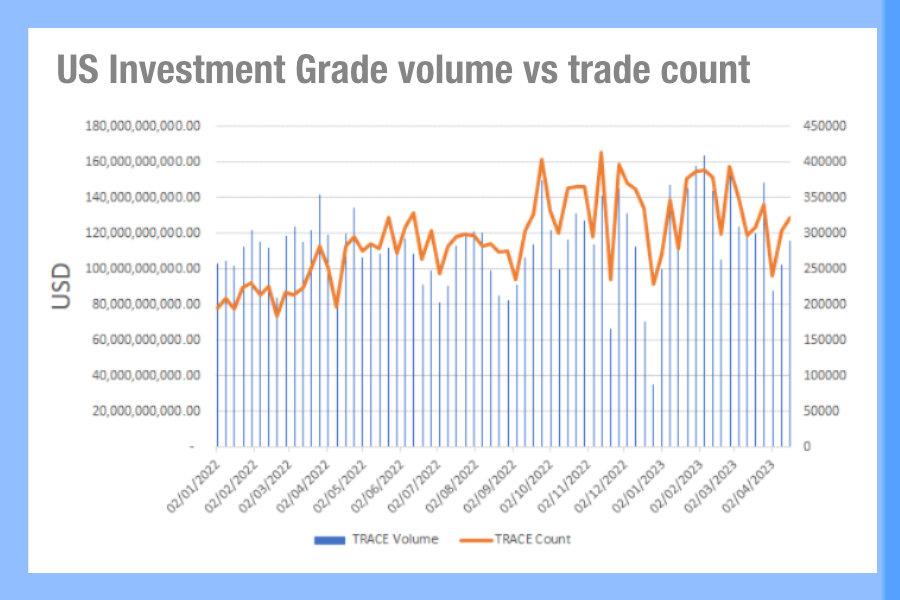 By contrast, US investment grade and HY trading has been closely correlated in 2023, with TRACE volume more frequently breaking past relative trading count, suggesting that fewer, larger trades are taking place at certain points.
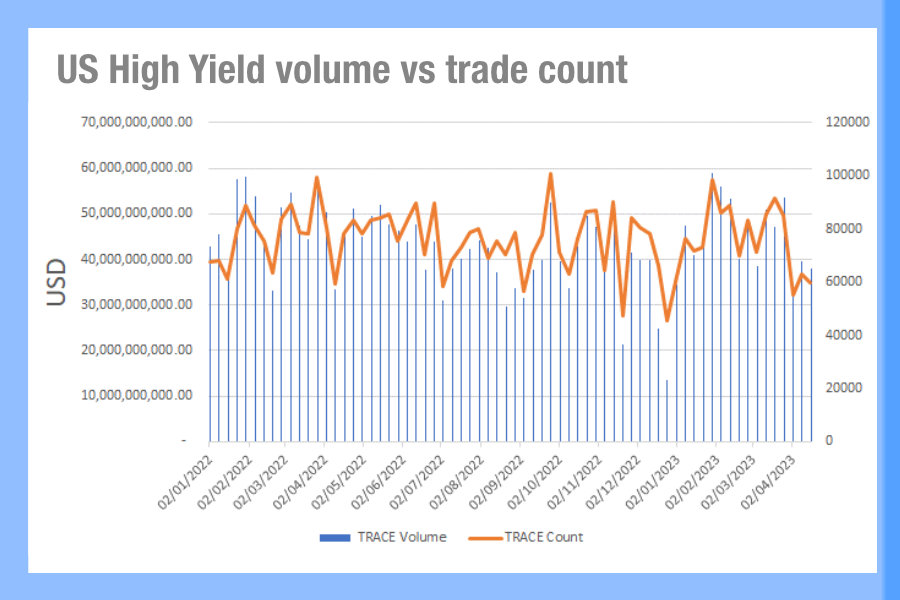
The average size of trade for US IG was US$500k at the start of 2022, before falling between US$300-400k over the past year and this year bouncing back to closer around US$400k. US HY average trade size has been between US$500k-600k over the past year, hitting the US$600k track seen in Europe since the start of 2023.
These blocks of liquidity will be welcomed by buy-side traders; while anecdotally we know that trading US credit is typically easier than trading in Europe, the reports from traders on the ground in both continents is that liquidity has been terrible so far this year. Last year saw the use of all-to-all trading increase significantly via platforms as a result of limited bank trading capacity.
So while data is not showing that directly at a high level, analytics are needed to look beyond simple metrics to assess exactly how and where they can find the other side to a trade.
©Markets Media Europe 2023
©Markets Media Europe 2025


