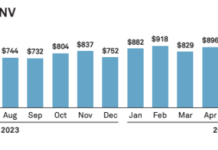
A report by market analysis form Coalition Greenwich, part of S&P Global, has found that after an active first quarter, corporate bond trading slowed down in April with average daily notional volume (ADNV) coming in at US$35 billion, down 3% from April 2022 and 13% from the month before.
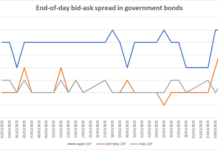
The average daily trade count declined 3% from the month before but remained 22% ahead of April 2022, which the firm saw as evidence that retail demand for bonds continues as the Fed’s rate-hiking cycle is likely approaching its end. Looking at MarketAxess Bid-Ask Spread Index (BASI) it noted that bid-ask spreads have been steadily rising since the summer of 2021 potentially as a result of rising interest rates, recession concerns and dealers less willing to take bonds into inventory. However, it also found that the BASI data average for April 2023 (6.66bp) is only 1% higher than the average value over the past 10 years (6.56bp) suggesting a reversion to the norm. While it noted that market share by electronic trading platforms has not changed over the past year with dealer-to-client RFQ dominated by MarketAxess, and portfolio trading by Tradeweb, electronic trading activity in April, making up 40% of IG, and 29% of HY suggests the market remains in its “new state of normal”.
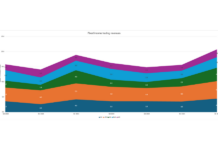
Open Trading trade count in Q1 2023 for MarketAxess was up 27% from Q1 2022 and Tradeweb reported an average daily net volume (ADNV) of US$1.3 billion in Q1 2023, up 36% from the same quarter last year, while portfolio trading on MarketAxess and all-to-all trading on Tradeweb have also grown in volume terms. In US Treasuries, April’s average daily notional volume (ADNV) of US$653 billion was down 8% month over month, and down 8% from April 2022, but a record 36% of overall trading activity was handled via RFQ platforms at the expense of phone/chat. “The original RFQ protocol implemented via Tradeweb nearly 25 years ago automated the dominant phone-based workflow of the time,” wrote the report author, Kevin McPartland. “Instead of calling three dealers, you could simultaneously send those three dealers a message asking for a price. Not rocket science in 2023, but quite innovative at the time. Today’s RFQ is barely recognisable compared to that original incarnation. Requests are often sent and responded to with zero human intervention. They utilise dealer ranking statistics, AI-generated prices, dealer pricing streams, and linkages to order book markets. Today’s RFQ is an iPhone compared to the StarTAC of 1999.
The result is a more highly engaged buy side, that respects the value (and balance sheet) the dealers bring to the U.S. Treasury market, but loves the ways in which technology is making life (and liquidity access) easier.” Market volume remained remained slightly higher than 2022’s average of US$651 billion per day, and the last week of the month saw an ADNV of US$762 billion, with US$1 trillion traded on 28 April.
“The buy side’s adoption of electronic trading continued in earnest in April,” noted McPartland. “E-trading in the dealer-to-client market hit its highest level ever, with trading venues (primarily Bloomberg and Tradeweb) handling 61% of the ADNV (compared to 66% of ADNV when dealer-to-dealer trading is included). The previous high-water mark was 60% in September 2021.”
©Markets Media Europe 2023
©Markets Media Europe 2025


