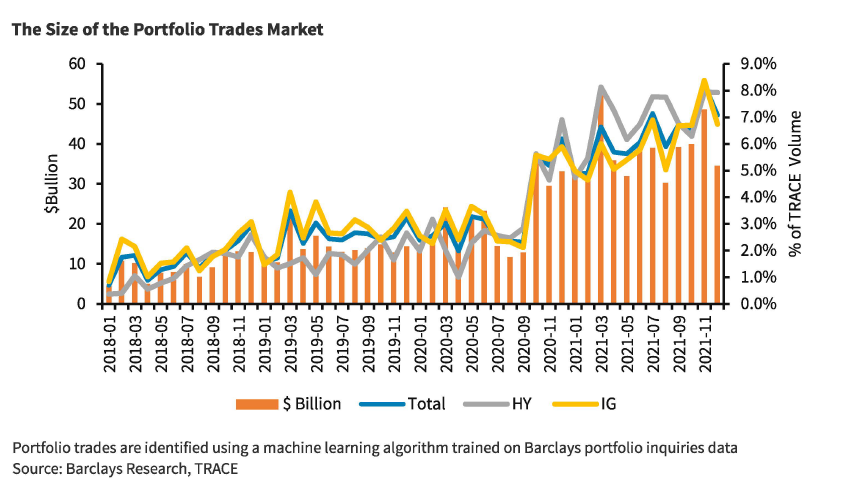
Barclays has conducted new analysis into portfolio trading of corporate bonds, estimating the trading protocol now makes up 8% of US credit trading.
The firm notes its own portfolio trading, which involves trading a basket of bonds as a single piece of risk and trading the entire basket with one dealer, has grown “tremendously” over the last four years from “virtually zero” volume in 2018 to more than 2,000 inquiries and US$175 billion in volume in 2021.
The report, authored by Jeffrey Meli and Zornitsa Todorova of the fixed income, currencies and commodities research department, and supported by Akshat MittaI and Adam Kelleher from the firm’s data science team, was based on data from a proprietary list of portfolio enquiries received by the Barclays trading desk, and an algorithm developed to track the footprint of a typical portfolio trade in the US TRACE post-trade tape.
They used this footprint to identify other portfolio trades in TRACE that are not in the ban’s enquiries database, estimating that portfolio trading now comprises 8% of total bond trading volumes, in both investment grade and high yield – a substantial increase from almost 0% in 2018.
They also examined the typical portfolio construction strategies used by investors and found that that investors use one or a combination of three main strategies:
• Index-like portfolio trades with no systematic differences from their benchmarks: these are more common in HY, where 73% of portfolios adopt this strategy vs only 31 % in IG. Investors typically use this strategy to manage large flows – to quickly raise cash or buy bonds.
• Portfolio trades that “crowd source” liquidity for a set of very illiquid bonds: investors combine liquid and illiquid bonds, so the former effectively cross-subsidizes the latter. This strategy covers 49% of IG portfolios and 18% of HY portfolios.
• Portfolios designed to take a market view, targeting a specific maturity, sector and/or rating.
In its study, the bank found that the average portfolio trade identified in TRACE in 2021 contained 100 line items and US$70 million of notional, divided fairly equally across the bonds in the portfolio.
The number of line items per portfolio had steadily grown since the beginning of 2021, whereas dollar volumes have been relatively stable which the paper notes “likely reflects advancements in technology, which has enabled dealers to price a larger basket of bonds in a very short time” while “the increase in aggregate volumes was largely driven by an increase in the number of portfolio trades, which likely reflects an increasing number of clients using this protocol.”
Interestingly, trading of illiquid bonds was found to be a “far more common strategy in investment grade (IG) than in high yield (HY)” while investors rarely build portfolios of only illiquid bonds, with portfolios typically designed so that very liquid bonds “cross-subsidise” illiquid bonds, particularly for HY portfolios, which the team found notable for two reasons: “First, the absolute level of transaction costs is higher in HY. Second, the far right tail of the Liquidity Cost Score (LCS), distribution is considerably thicker in HY than in IG, meaning that if an investor wants to trade those very illiquid bonds, they need many more liquid bonds to offset the overall drag on liquidity than is the case in IG.”
Most portfolio inquiries were either HY only or IG only, with mixes typically happening for bonds at the boundary of credit ratings, such mixing BAA3s and BAls rather than “95 B2 bonds and five AAA bonds … even if the direction (buy or sell) matches”.
The research also noted that portfolio trades are typically either buy-only, sell-only or balanced buy-and-sells trades, rather than an uneven proportion of buying and selling; “a candidate cluster where a client buys 97 bonds and sells three bonds is extremely unlikely – in reality, this is a buy-only trade with 97 bonds and the three sell trades were coincidentally executed at the same time.”
Based on its analysis, the team predicts that portfolio trading will continue to grow given ‘spillover benefits’ as more investors use the protocol and as dealers and investors develop technology to efficiently price, execute and hedge portfolios.
©Markets Media Europe 2025

