Earlier this year we noted that average trade sizes were down considerably on 2022, but being wary of mean reversion, we wanted to revisit this trend.
Taking data from MarketAxess Trax, which tracks trading across multiple markets and counterparties, we looked at US markets’ investment grade (IG) and high yield (HY) trade count and notional traded, year-to-date for 2023 and 2022. By dividing the total notional traded by the trade count, we were able to determine the average size of a trade.
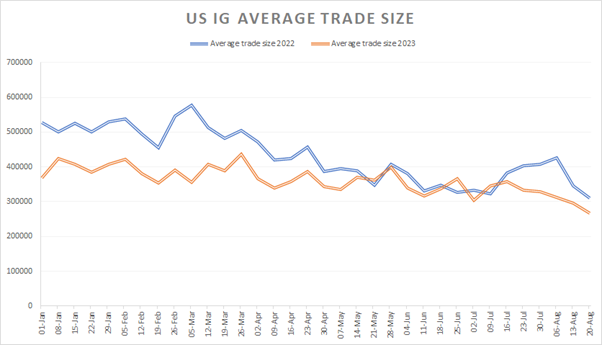
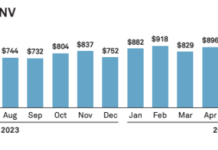
We can see that for IG, average trade sizes were about 20% lower for Q1 in 2023 year-on-year, around the US$400k mark from US$500k the year before. In Q2 the difference began to reduce, not because average size was increasing in 2023, but because average trade size declined substantially in Q2 2022, dropping to the US$400k mark by May 2022 and continuing down, with a spike in summer that fell back again by late August.
In 2023 the decline continued, with the range of US$400k falling to US$3-400k in May and June, then below US$300k for the first time this year in mid-August.
That supports the hypothesis that trade sizes are falling in IG, which was around 43% electronic according to Coalition Greenwich data.
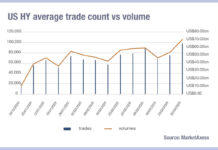
The story in HY is less clear. Average trade sizes in 2023 have more closely followed the pattern for 2022, and although they started the year slightly lower, they have remained relatively flat in the US$500k-600k range. Last year saw a more clearly-defined decline in trade sizes, moving from US$600k+ in January down to the US$500k-600k range and then falling below US$500k in August fo the first time that year.
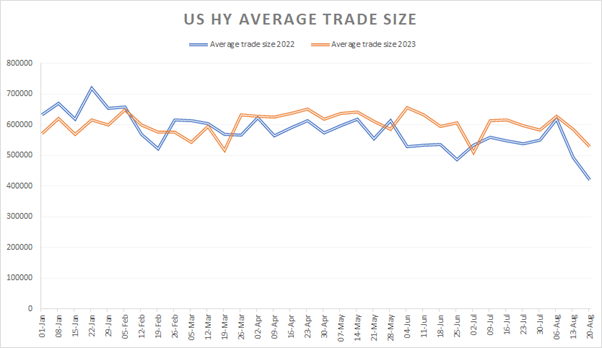
On that basis there is not clear evidence of a decline in HY average trade sizes in the US market, which was approximately 31% electronified in July 2023, according to Coalition Greenwich data.
Given that electronification has remained relatively flat year-on-year, there does seem to be evidence that trade sizes are falling in US IG, irrespective of the pace of electronification.
©Markets Media Europe 2023
©Markets Media Europe 2025

