


As bid-ask spreads tighten and fees rise, dealers question making markets in credit.
It does not take a quant to understand that tighter bid-ask spreads and higher platform fees reduce the amount of money that liquidity providers can make in the bond markets.
The issue is particularly acute in investment grade credit, where the average bid-ask spread has fallen by 33% in US markets and 40% in Europe since the start of the year, according to MarketAxess’s CP+ data.
As bid-ask spreads fall, the explicit costs of trading on platforms via fees are increasing.

Angelo Proni, CEO of trading platform provider, MTS Markets, says, “There is a trend of increasing sensitivity by all players to platform trading costs. Not only the number that is at the bottom of the page of any invoice but also the cost per million. It’s been a growing market, so inevitably, there will be an increase in the nominal cost but you’ve got to calculate by per million traded. That’s ultimately going to inform the way the instruments are priced by the dealers to the clients.”
Justine Robertson, head of US sales and client strategy at credit trading platform, Trumid, says, “Fees are increasingly an important part of the conversation. With a focus on request for quote (RFQ), over the last 3-4 months, we’ve been out on the road meeting with clients across the US. The buy side are focused on transaction costs, not only in terms of the execution fee on the trade, but also proven delivery of cost savings.”

One sell-side estimate of transaction costs paid by liquidity providers to CME, ICE, LSEG, Tradeweb, MarketAxess and Bloomberg in 2023 was US$12.8 billion, based on public filings and industry estimates, up from US$7.95 billion in 2019.
CME had the largest share of this, with its 10k filing reporting US$4.6 billion from net transaction and clearing fees, up 11% from US$4.1 billion in 2023 which in turn was up 10% from the US$3.8 billion earned in 2022. Volumes grew 5% between 2022 and 2023, with fee increases accounting for the rest of the growth in revenue.
ICE generated the second largest share at US$3.9 billion in transaction revenues in 2023, 8% up on the US$3.6 billion for 2022, while average daily volumes increased 10% year on year (YoY).
These results are not surprising, as both offer a range of fixed income and other proprietary contracts, to generate those revenues, giving them massive market share and limited competitive pressure on pricing.
Trading venues that intermediate over-the-counter (OTC) products, which are fungible to trade via any authorised platform, take a lesser share of overall transaction revenue.
Tradeweb’s 10k for 2023 reports transaction fee revenue of US$1.1 billion, up 13.5% year-on-year (YoY), while average daily volume across all instruments increased by 57% over the same period. MarketAxess’s 2023 filing reported a 3.4% YoY increase in transaction commissions to US$663 million, up from US$641 million, while average daily volumes declined 7.5% across all instruments.
Bloomberg is estimated to have made about US$550 million from non-terminal and data income in 2023 by industry sources, however this is said by one source close to the company to be north of the real figure. Analyst firm Burton Taylor reporting total non-terminal revenue in 2022 was US$4 billion.
Cost concerns are driving competition. In 2024 two platform operators launched rival offerings to incumbents in fixed income. BGC launched its FMX exchange which plans to trade Treasury futures in competition with CME from 2025, and MTS entered the European corporate bond market with its BondVision platforms in September 2024, specifically competing on costs. Notably, both are well back by sell-side firms keen on supporting greater competition.
How much dealers pay
Individually, sell-side firms see very different levels of cost as a result of transaction fees. One estimated an average 10% year on year increase in fees across trading platforms over the past five years, although Bloomberg was said to have been increasing fees at a slower rate. The largest estimate for on-platform trading costs growth was a 500% increase over five years.
A widely quoted figure at the Fixed Income Leaders’ Summit this year was that intermediation costs made up about 75% of explicit trading costs for dealers.
The reason for this disparity in reported figures, is that costs are relative to activity levels, instruments traded, but also highly customised per-trade fee schedules, weighted according to a multiplicity of factors.
The explicit costs being charged by platforms is not always disclosed publicly. In many jurisdictions pricing schedules are not made public. The exception is Europe, where all multilateral trading facilities (MTFs) – the equivalent of US electronic trading networks (ECNs) – are required to publish their fee schedules, and in fixed income this allows some analysis to be made of pricing paid on trades. However, the fee schedules are very complex.
This complexity is created by the range of possible influences on a final price paid, which include known pre-trade factors around the order, such as the size of an order, the tenor of the bond, and a pre-selected dealer package being used (which sets discounts based on a minimum spend), however it also includes post-trade aspects such as discounts based on dealer ranking of volumes traded on a given platform e.g. top 5/top 10 by volume, which in turn makes pre-trade awareness of execution costs impossible to fix.
Proni says MTS’s BondVision is actually competing on the legibility of its fee schedule.
“What differentiates us is that our fees are much more transparent, built in such a way that they are pretty easy to read and to determine what the cost per million will be,” he notes. “Sometimes things are presented in a complex manner by design, to deliberately obfuscate. It’s a common commercial proposition, and we haven’t done that, so beyond the fact that is our fees are lower, it’s they’re also easier to determine.”
The model of charging used – and the components included – are billed for on a totally different basis for different trading protocols. Dealers also challenge some of the metrics used, one observing, “The charges per transaction are different if you are processing a ticket for a bond with six months in maturity versus trading a 30-year bond, Why? They charge you more for that, which is ridiculous.”
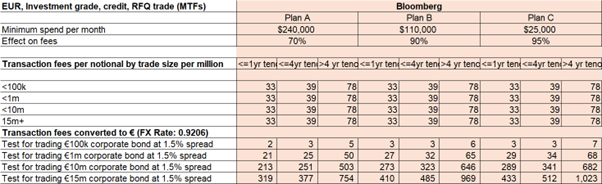
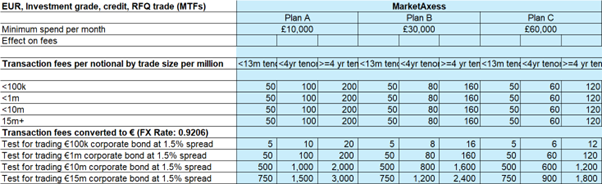
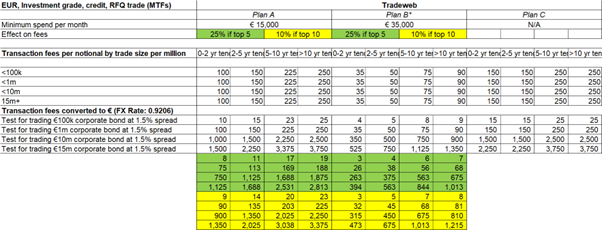
The DESK attempted to run a like-for-like comparison between Bloomberg, MarketAxess, and Tradeweb, for a liquidity provider to trade an investment grade corporate bond priced in euros using the common request-for-quote (RFQ) protocol.
“There are 184 possible price outcomes that might be paid just for an investment grade corporate bond trade, priced in euros”
It found there are 184 possible price outcomes that might be paid, based on those variables. A comparison can be found here (zoom to expand):
This complexity of these schedules is then compounded by the model for presenting costs to the liquidity provider.
“Relatively large dealers will have multiple legal entities to trade on the same platform,” notes one. “When a platform sends you the bill, they will send you it at an entity level; one bill from the EU MTF and one from the UK MTF, the US ECN etc. For each of the entity, I can receive multiple invoices and across multiple products. So how would a dealer figure out individual ticket charges?”
Changes to service offerings have also discombobulated sell side firms. Bloomberg once provided trading services within the cost of its terminal fee, but over time has expanded its use of transactional fees. Most recently it has told dealers it plans to charge for foreign exchange trading, which is currently free.

“We’ve had a commercial model for our global regulated platforms since 2013, following to launch of Bloomberg’s swaps execution facility (SEF) in the US,” notes Nicholas Bean, global head of electronic trading at Bloomberg. “The most recent major revision to this model was in 2021 where we established a largely harmonised global schedule. European regulation requires commercials to be in the public domain and as our model is consistent, our transparency is very high.”
Why spreads are tightening and costs rising
The level of competition between liquidity providers is intense in certain fixed income markets, notably Euro and US dollar denominated investment grade credit, and that is a major factor in the tightening of bid-ask spreads.
“It is absolutely over-broked,” confirms one head of buy-side trading. “At the moment, when liquidity is good and the bond velocity is high, anyone can get into or out of a bond. There are so many liquidity providers out there. That is why there is a race to the bottom, in terms of margin compression, and bid- offer.”
“There are so many liquidity providers out there. That is why there is a race to the bottom, in terms of margin compression, and bid- offer.”
A period of major, unexpected volatility can shake the market up enough to change that, he says.
“All you need is a huge dislocation, like, say, an election or something like that, and all the fly-by-night players will either turn off their algos, widen out their bid offers or blow themselves up. Then everyone will renormalise. It’s a very cyclical process.”
Another challenge is that during periods of excepted lower level turbulence, real money asset managers tend to reduce trading activity, and hedge funds tend to increase trading activity. That reduces net buy-side engagement so liquidity drops off.
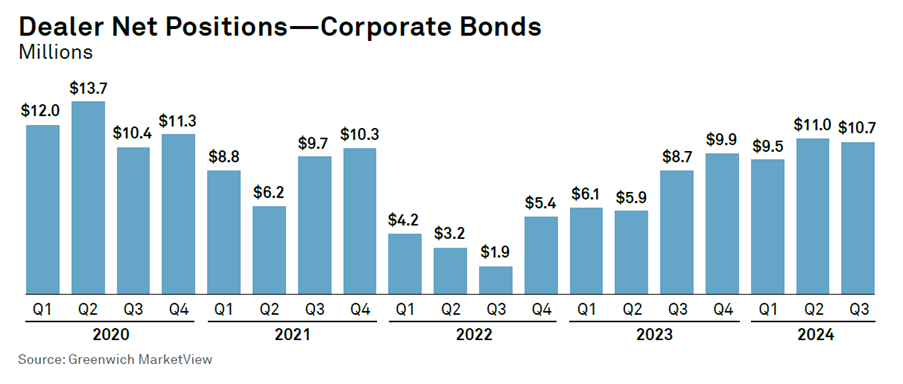
As banks have been increasing their net bond holdings, based on Coalitions Greenwich data, when they need to reduce these they are forced to compete even harder on cost.
“Spreads are getting tighter because there’s not a lot of movement happening [in the market],” notes one senior sell-side figure. “Hence bid offers are getting tighter to get trades moving. A lot of firms are probably taking a loss on trading, just to get risk off the books, and they’re not taking into account all the cost that come in [as a result].”
The value of trading on a platform
While there is a cost to trading on platform there are also considerable benefits, as these provide a network effect for the pooling of orders and liquidity, thereby reducing the costs for navigating a highly fragmented OTC market.

Richard Schiffman, global head of trading solutions at MarketAxess, says, “We are committed to competitive pricing for our clients, and believe in pricing our products/protocols commensurate to the value they deliver. Case in point, our all-to-all trading solution Open Trading – which delivered estimated price improvement of US$702 million in 2023, net of the fees we charge – continues to drive considerable benefit for our clients globally.”
“Our fees reflect the breadth of our offering and depth of liquidity available to our global network,” said a Tradeweb spokesperson.
Trumid’s Robertson added, “Trumid RFQ clients are realising cost savings platform-wide thanks to record platform engagement and a fully integrated RFQ responder network. Clients who have executed in our established RFQ offering are saving millions of dollars in annualised transaction costs, driven by our competitive RFQ fees and superior rates execution – savings which Trumid clients can also view in real-time through our integrated in-app analytics.”
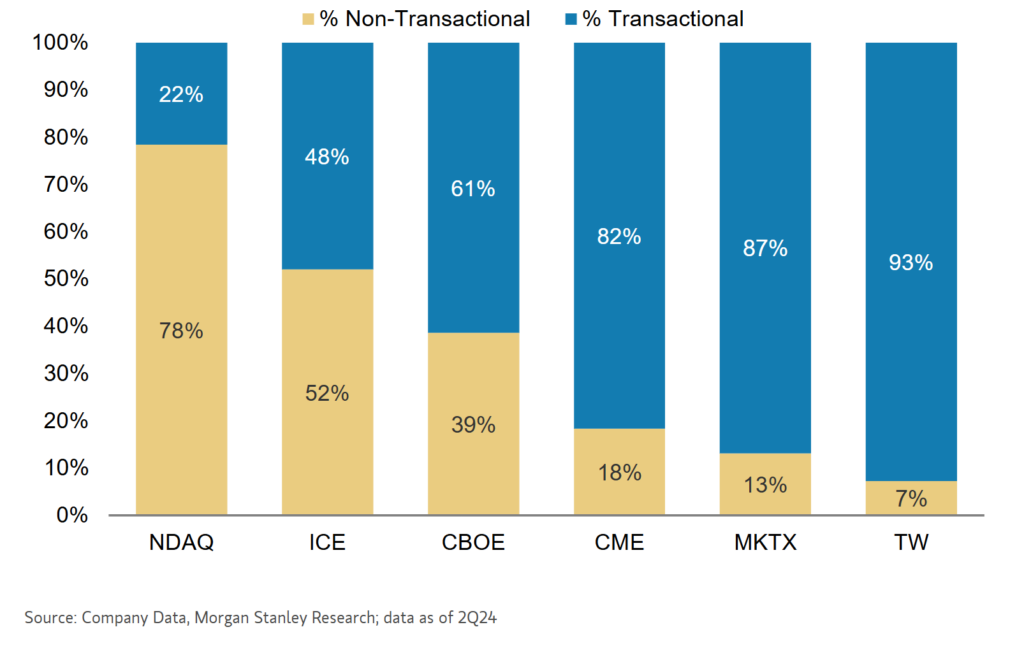
The reliance on transactions as a source of revenue varies greatly between markets, and Morgan Stanley analysis (Fig 2) shows it can be anywhere from 22% to 93% of income, which is then needed to support the firm.
“Our model reflects two key inputs,” says Bean. “First is the regulatory cost of operating a platform. These costs are increasing in scope and scale reflective of regulation. It is expensive to operate a regulated platform. The latest round of regulation is the Digital Operational Resilience Act (DORA) [an EU regulation that entered into force on 16 January 2023] which again requires more investment in order to be compliant.”
The second input is the firm’s investment in its solutions which he notes benefit both the buy side and the sell side.
“Observations have been made by both ESMA and the FCA regarding the trading venue perimeter because essentially, if software providers are able to operate solutions which mimic a regulated platform without incurring the regulatory costs, then why would regulated platforms persist their licenses,” he says. “This risk continues to provide regulatory interest, and operating regulated platforms is not getting cheaper.”
Something has got to give
Assuming costs continue to increase, and spreads continue to compress, the commercial pressure facing the sell-side will at some point become unbearable and something will have to give.
The first possible change will be that some dealers are unable to manage the cost/income ratio, and thus drop out of the market.
“The problem with these platforms is that volume is not the right metric for profitability of flow,” notes one dealer. “As markets go electronic, the size of trades go down, so the number of trades go up. It brings new entrants because there’s more transparency. It pushes the bid-ask spreads tighter so that so there’s less margin on these trades. But as volumes go up, frictional costs go up. Just as the pricing improves and the transparency improves, these brokerage-like models, charging by volume traded, drive costs up. At some point we’re going to have to start turning business away because of those fees. They will overtake the bid-ask spreads.”
The second is that liquidity providers begin to connect more directly with their buy-side clients, providing streamed prices that are not subject to venue transaction fees.
While the sell side note that this has been a viable solution in FX markets, it is still to take off in fixed income, outside of the US Treasuries market where it is largely used in the dealer-to-dealer space.
A third outcome is that dealers become far better at analysing the byzantine fee schedules to pre-judge trading costs, pre-trade.
“To stay in the game, we’re getting on top of these costs, and optimising operations constantly,” explains one sell-side head of trading. “They have a direct impact on the book’s P&L. We also have to make these costs more transparent to the trading desk, so when they price tickets, they are aware of different elements in the transaction cost.”
However, this is currently more an aspiration than an easily achieved target, the head of trading says.
“It’s very difficult to estimate that, particularly when the whole fee schedule is so complicated. You only get a final number with the invoice from the platform. It is very challenging for people to incorporate that directly into their pricing engines, and while some people claim they can do it, I think those are really just estimates.”
Another sell-side trading head says, “We negotiate as hard as we can with each platform every year on costs, and how we can bring them down internally. That includes data costs and software like Bloomberg terminals. I think the only way we can impact this is to either create more competition or encourage clients to use cheaper channels, such as direct connectivity.”
That final point is key, as fees may be adjusted either naturally by the platforms to decrease the cost pressure on users or that more platforms launch to create greater competition on pricing.
“Competition is a law of economics, not a theory,” says Proni. “The less competition there is, the more it becomes a seller’s market. Our initiative aims to promote both competition between platforms and competition between dealers for the incentives that we provide. That competition hopefully takes place within our platform and therefore achieves our aims. The one trade-off with increased competition is potentially having more fragmentation and less standardisation, which goes against the grain of efficiency. As ever these things need to be calibrated correctly, and it’s an ongoing process of calibration within the industry.”
“We’re trying to make it more transparent to our clients and to the trading desk,” says the head of trading. “Finally, we’re trying to encourage more healthy competition among the venues.”
*No non-disclosure agreements were harmed in the making of this article.
©Markets Media Europe 2024
©Markets Media Europe 2025


