US Treasury market volatility saw a decline in March, according to Coalition Greenwich’s April Data Spotlight on US rates trading. The MOVE Index monthly average was down 35% YoY to 98.63, and at the end of March reached its lowest point since February 2022.
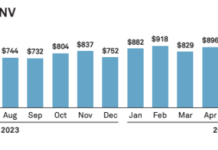
However, March Treasury volumes reduced just 4% YoY to US$829 billion average daily notional value (ADNV). This is particularly of note, the paper says, given the record trading day for US Treasuries following last year’s SVB collapse. Overall, Q1 set a new US$879 billion ADNV record.
Derivatives volumes were down, with Treasury futures, SOFR futures and USD interest-rate swaps falling 17%, 38% and 20% respectively YoY in March 2024. The results bring the cash-to-futures ratio back down to Q1 2023 levels, albeit above historic norms.
The report attributes these findings to lower volatility and the assumption that interest rates will fall, which can lead some to see less need to trade derivatives.
Structurally, e-trading saw trading between primary dealers hit a new low in Q1, falling to 26% of the total market from Q1 2023’s 31% and Q1 2019’s 35%. This decline has a negative impact on central limit order book (CLOB) activity, the report affirms, and reflects both the growing role of the buy side in the market and dealers’ inclinations to hedge through futures and internalisation.
This drop was reflected cyclically. Volatility spiked in March 2023 as a result of the regional bank crisis, generating more volume for CLOB platforms – particularly non-banks. In March 2024, although total market volume was on par YoY, reduced volatility meant that the same trading activities were not available to firms.
“This is why dealer-to-client e-trading held steady year over year, yet total market e-trading declined,” the report explained.
Also of note in March was FINRA’s update to its reporting of US Treasury trading data. Trade-by-trade level data for on-the-run nominal coupons is now publicly available, along with ongoing daily aggregate data.
“We find it notable that the average daily trade count for only 10-year on-the-run Treasuries (~60,000–100,000) can easily surpass the total number of all US corporate bond trades,” observes Kevin McPartland, head of research for market structure and technology at Coalition Greenwich and author of the report. “The US might have more debt than some would like, but the world thus far continues to enjoy trading it.”
©Markets Media Europe 2024
©Markets Media Europe 2025


