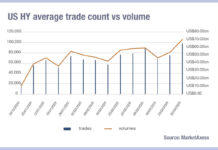
Looking at corporate bond trading volumes over the past two weeks, data from MarketAxess appeared to show a recovery since levels plummeted in May 2022. While high yield (HY) was worst hit – and even then was not in the same dire position as European volumes which halved in volume in some cases – the overall trend this year is still very tough for US credit.
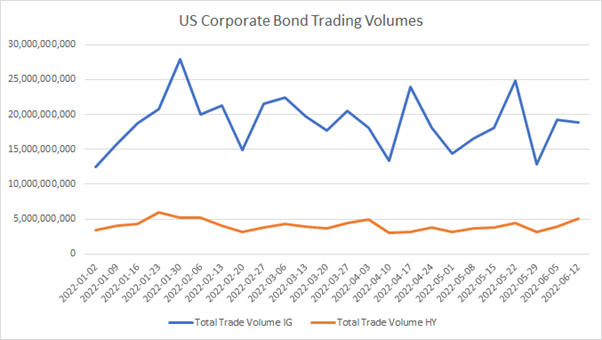
Volumes have been enormously volatile in H1 of 2022 with investment grade (IG) seeing variations of up to US$10 million, even beyond that in May. HY trading volume has been more rangebound at just below US$5 million on average, however that is of little comfort for traders looking for liquidity.
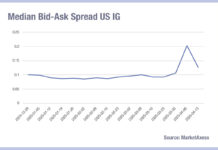
If we take the bid-ask spreads for both IG and HY, thing look more concerning. The Average for IG trades has crept up consistently during the year, tipping upwards to hit 6bps in the week of 12 June, where it was around the 3bps mark throughout January.
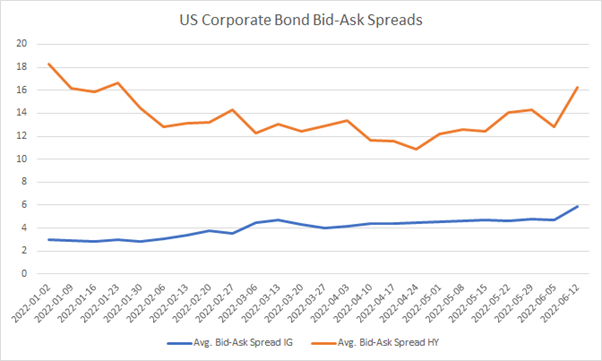
High yield has been more volatile – as would be expected – but starting the year at over 18bps on average, had dropped down to 11bps in April. It has started to tilt sharply upwards in recent weeks as the Federal Reserve’s hawkish rate policy became evident, and now sits above 16bps in June.
Taken together, it is clear to see that price and liquidity formation in the US markets is getting harder. Buy-side firms with access to the right data pre-trade – and of course strong dealer relationships – are likely to find themselves in a far stronger position to negotiate, however to reap the rewards of trading efficiency through more electronic trading it will be vital to represent that data in as effective way as possible within electronic trading tools, be that pre- or at-trade.
©Markets Media Europe 2025

